29
/pt/
pt
AIzaSyAYiBZKx7MnpbEhh9jyipgxe19OcubqV5w
April 1, 2024
87217
Bolivia
BOL
true
2
1
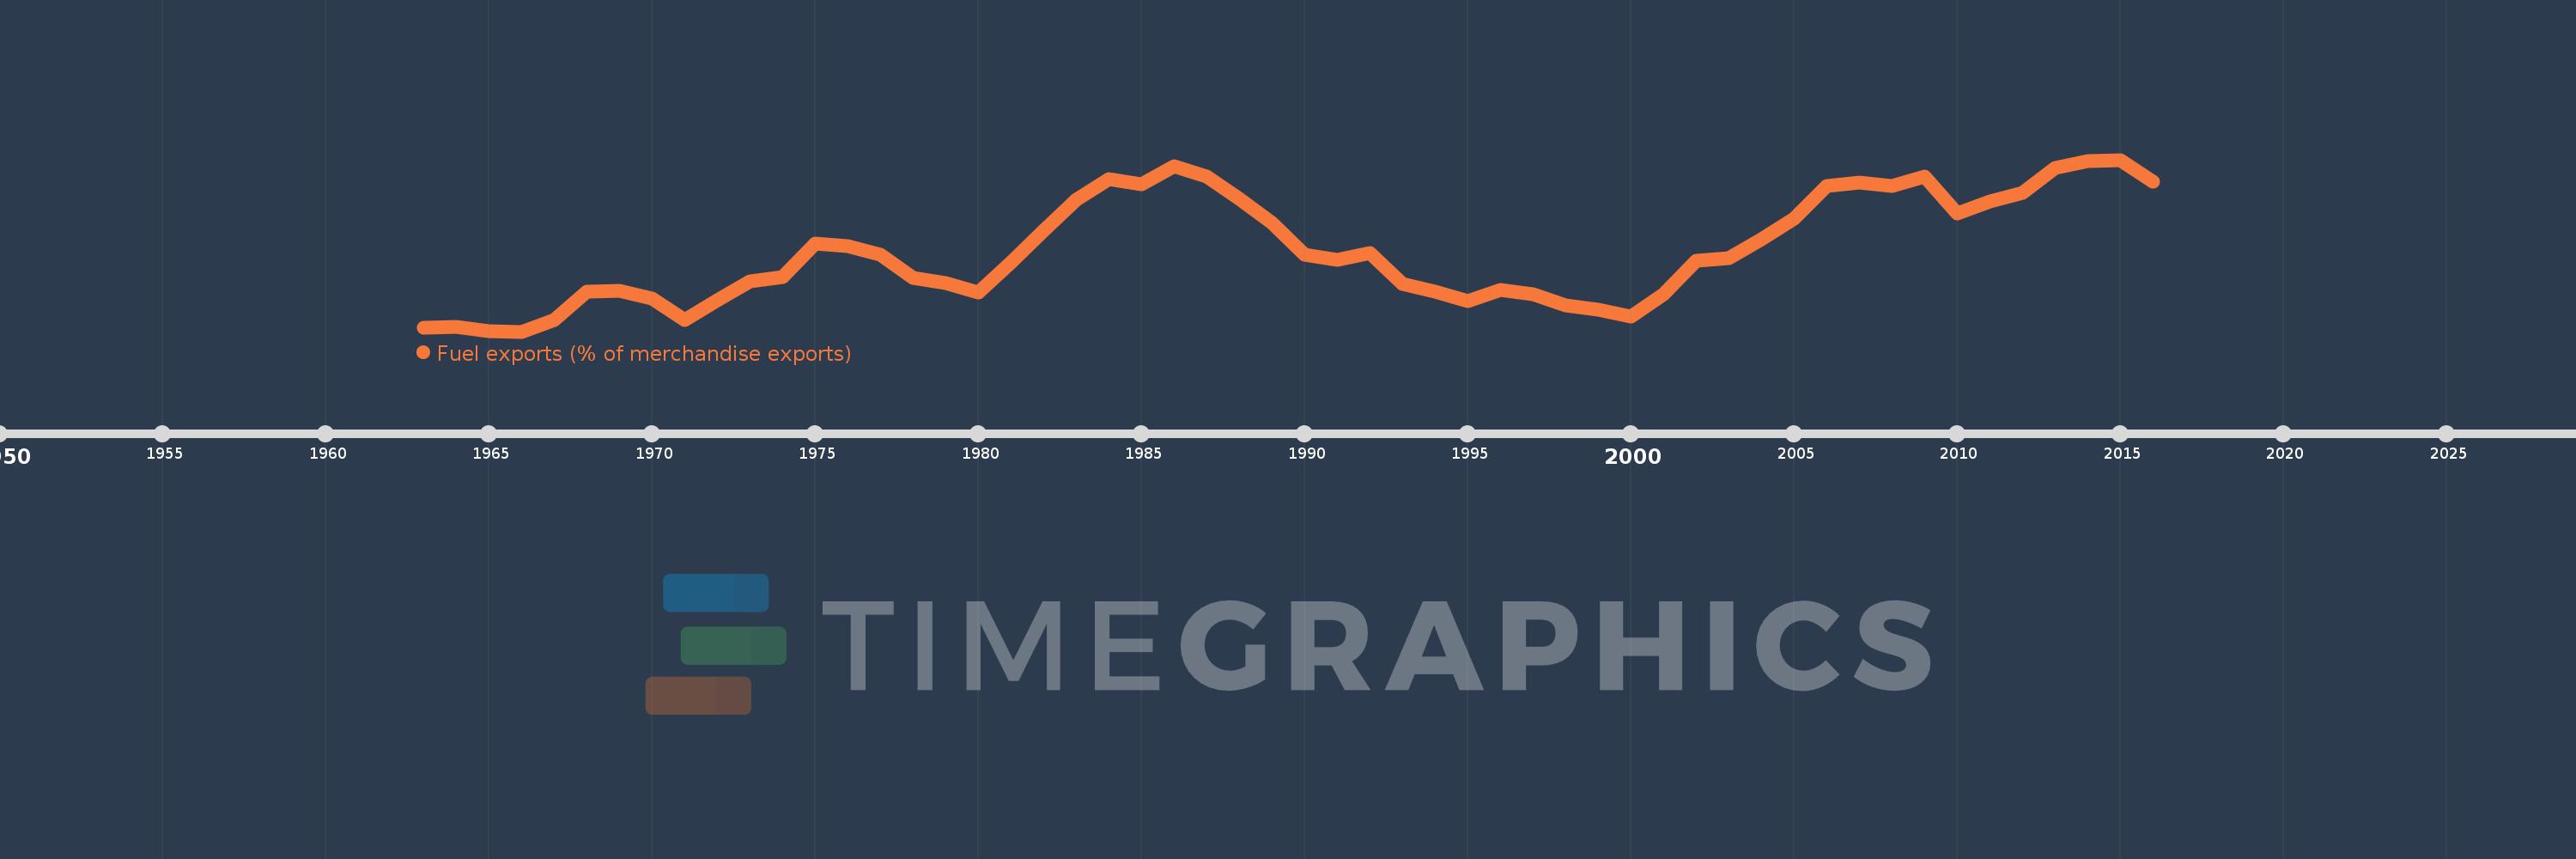
Fuel exports (% of merchandise exports)
2016,2015,2014,2013,2012,2011,2010,2009,2008,2007,2006,2005,2004,2003,2002,2001,2000,1999,1998,1997,1996,1995,1994,1993,1992,1991,1990,1989,1988,1987,1986,1985,1984,1983,1982,1981,1980,1979,1978,1977,1976,1975,1974,1973,1972,1971,1970,1969,1968,1967,1966,1965,1964,1963
Estas estatísticas em outros países:
AfghanistanAlbaniaAlgeriaAndorraAngolaAntigua and BarbudaArab WorldArgentinaArmeniaArubaAustraliaAustriaAzerbaijanBahamas, TheBahrainBangladeshBarbadosBelarusBelgiumBelizeBeninBermudaBhutanBoliviaBosnia and HerzegovinaBotswanaBrazilBrunei DarussalamBulgariaBurkina FasoBurundiCabo VerdeCambodiaCameroonCanadaCaribbean small statesCayman IslandsCentral African RepublicCentral Europe and the BalticsChadChileChinaColombiaComorosCongo, Dem. Rep.Congo, Rep.Costa RicaCote d'IvoireCroatiaCubaCyprusCzech RepublicDenmarkDjiboutiDominicaDominican RepublicEarly-demographic dividendEast Asia & PacificEast Asia & Pacific (excluding high income)East Asia & Pacific (IDA & IBRD countries)EcuadorEgypt, Arab Rep.El SalvadorEquatorial GuineaEritreaEstoniaEthiopiaEuro areaEurope & Central AsiaEurope & Central Asia (excluding high income)Europe & Central Asia (IDA & IBRD countries)European UnionFaroe IslandsFijiFinlandFragile and conflict affected situationsFranceFrench PolynesiaGabonGambia, TheGeorgiaGermanyGhanaGreeceGreenlandGrenadaGuatemalaGuineaGuinea-BissauGuyanaHaitiHeavily indebted poor countries (HIPC)High incomeHondurasHong Kong SAR, ChinaHungaryIBRD onlyIcelandIDA & IBRD totalIDA blendIDA onlyIDA totalIndiaIndonesiaIran, Islamic Rep.IraqIrelandIsraelItalyJamaicaJapanJordanKazakhstanKenyaKiribatiKorea, Rep.KuwaitKyrgyz RepublicLao PDRLate-demographic dividendLatin America & Caribbean Latin America & Caribbean (excluding high income)Latin America & the Caribbean (IDA & IBRD countries)LatviaLeast developed countries: UN classificationLebanonLesothoLiberiaLibyaLithuaniaLow & middle incomeLower middle incomeLuxembourgMacao SAR, ChinaMacedonia, FYRMadagascarMalawiMalaysiaMaldivesMaliMaltaMauritaniaMauritiusMexicoMiddle East & North AfricaMiddle East & North Africa (excluding high income)Middle East & North Africa (IDA & IBRD countries)Middle incomeMoldovaMongoliaMoroccoMozambiqueMyanmarNamibiaNepalNetherlandsNew CaledoniaNew ZealandNicaraguaNigerNigeriaNorth AmericaNorwayOECD membersOmanOther small statesPacific island small statesPakistanPalauPanamaPapua New GuineaParaguayPeruPhilippinesPolandPortugalPost-demographic dividendPre-demographic dividendQatarRomaniaRussian FederationRwandaSamoaSao Tome and PrincipeSaudi ArabiaSenegalSerbiaSeychellesSierra LeoneSingaporeSlovak RepublicSloveniaSmall statesSolomon IslandsSomaliaSouth AfricaSouth AsiaSouth Asia (IDA & IBRD)SpainSri LankaSt. Kitts and NevisSt. LuciaSt. Vincent and the GrenadinesSub-Saharan Africa Sub-Saharan Africa (excluding high income)Sub-Saharan Africa (IDA & IBRD countries)SudanSurinameSwazilandSwedenSwitzerlandSyrian Arab RepublicTajikistanTanzaniaThailandTimor-LesteTogoTongaTrinidad and TobagoTunisiaTurkeyTurkmenistanTurks and Caicos IslandsTuvaluUgandaUkraineUnited Arab EmiratesUnited KingdomUnited StatesUpper middle incomeUruguayVanuatuVenezuela, RBVietnamVirgin Islands (U.S.)WorldYemen, Rep.ZambiaZimbabwe Linha do tempo:
Nesta escala de tempo está apresentado um gráfico de 1963 ano até 2016 ano Bolivia. Dados de 1962 ano ausente. O número de observações reais por data: 54.
Fonte (nome):
Indicadores de desenvolvimento mundial
Fonte (organização):
World Bank staff estimates from the Comtrade database maintained by the United Nations Statistics Division.
Categorias:
Energy & Mining, Private Sector, Trade
Foi atualizado:
23 abr 2017 ano
Indicadores de alterações dos valores ao longo dos anos
Mínimo:
0.575
1 jan 1966 ano
Máximo:
57.821
1 jan 2015 ano
Na data de observação
Valor
Mudança absoluta
A alteração em relação ao valor anterior
1 jan 1963 ano
1.94
+1.94
0.0%
1 jan 1964 ano
2.2
+0.261
13.44%
1 jan 1965 ano
0.642
-1.558
-70.8%
1 jan 1966 ano
0.575
-0.067
-10.43%
1 jan 1967 ano
4.407
+3.832
665.88%
1 jan 1968 ano
13.756
+9.349
212.13%
1 jan 1969 ano
14.235
+0.479
3.48%
1 jan 1970 ano
11.699
-2.535
-17.81%
1 jan 1971 ano
4.531
-7.168
-61.27%
1 jan 1972 ano
11.06
+6.529
144.09%
1 jan 1973 ano
17.297
+6.238
56.4%
1 jan 1974 ano
18.619
+1.322
7.64%
1 jan 1975 ano
29.826
+11.207
60.19%
1 jan 1976 ano
29.047
-0.78
-2.61%
1 jan 1977 ano
26.294
-2.753
-9.48%
1 jan 1978 ano
18.567
-7.727
-29.39%
1 jan 1979 ano
16.671
-1.896
-10.21%
1 jan 1980 ano
13.567
-3.104
-18.62%
1 jan 1981 ano
23.658
+10.09
74.37%
1 jan 1982 ano
34.173
+10.515
44.45%
1 jan 1983 ano
44.492
+10.319
30.2%
1 jan 1984 ano
51.379
+6.888
15.48%
1 jan 1985 ano
49.786
-1.593
-3.1%
1 jan 1986 ano
55.659
+5.872
11.8%
1 jan 1987 ano
52.268
-3.391
-6.09%
1 jan 1988 ano
44.939
-7.329
-14.02%
1 jan 1989 ano
36.643
-8.296
-18.46%
1 jan 1990 ano
26.172
-10.471
-28.58%
1 jan 1991 ano
24.565
-1.607
-6.14%
1 jan 1992 ano
26.763
+2.198
8.95%
1 jan 1993 ano
16.519
-10.245
-38.28%
1 jan 1994 ano
13.976
-2.543
-15.39%
1 jan 1995 ano
10.65
-3.326
-23.8%
1 jan 1996 ano
14.554
+3.904
36.66%
1 jan 1997 ano
13.074
-1.48
-10.17%
1 jan 1998 ano
9.216
-3.857
-29.5%
1 jan 1999 ano
7.963
-1.253
-13.6%
1 jan 2000 ano
5.626
-2.338
-29.35%
1 jan 2001 ano
12.977
+7.351
130.67%
1 jan 2002 ano
24.082
+11.105
85.58%
1 jan 2003 ano
24.974
+0.893
3.71%
1 jan 2004 ano
31.457
+6.482
25.96%
1 jan 2005 ano
38.152
+6.695
21.28%
1 jan 2006 ano
49.214
+11.062
28.99%
1 jan 2007 ano
50.352
+1.138
2.31%
1 jan 2008 ano
49.177
-1.176
-2.33%
1 jan 2009 ano
52.304
+3.127
6.36%
1 jan 2010 ano
40.007
-12.297
-23.51%
1 jan 2011 ano
43.877
+3.87
9.67%
1 jan 2012 ano
46.724
+2.847
6.49%
1 jan 2013 ano
55.005
+8.281
17.72%
1 jan 2014 ano
57.25
+2.245
4.08%
1 jan 2015 ano
57.821
+0.571
1.0%
1 jan 2016 ano
50.395
-7.426
-12.84%
Classificação de países por estatísticas atuais por anos


Comentários: