30
/pt/
AIzaSyAYiBZKx7MnpbEhh9jyipgxe19OcubqV5w
April 1, 2024
86343
Bhutan
BTN
true
2
1
Other expense (% of expense)
2015,2014,2013,2012,2011,2010,2009,2008,2007,2006,2005,2004,2003,2002,2001,2000,1999,1998,1997,1996,1995,1994,1993,1992,1991
Download
Biblioteca de estatísticas globais →Bhutan →

Other expense (% of expense)

Estas estatísticas em outros países:

AfghanistanAlbaniaAlgeriaAngolaArab WorldArmeniaAustraliaAustriaAzerbaijanBahrainBangladeshBarbadosBelarusBelgiumBelizeBeninBhutanBoliviaBosnia and HerzegovinaBotswanaBrazilBulgariaBurkina FasoBurundiCabo VerdeCambodiaCanadaCaribbean small statesCentral African RepublicCentral Europe and the BalticsChileColombiaCongo, Dem. Rep.Congo, Rep.Costa RicaCote d'IvoireCroatiaCyprusCzech RepublicDenmarkDominican RepublicEarly-demographic dividendEast Asia & PacificEast Asia & Pacific (excluding high income)East Asia & Pacific (IDA & IBRD countries)Egypt, Arab Rep.El SalvadorEquatorial GuineaEstoniaEthiopiaEuro areaEurope & Central AsiaEurope & Central Asia (excluding high income)Europe & Central Asia (IDA & IBRD countries)European UnionFijiFinlandFranceGambia, TheGeorgiaGermanyGhanaGreeceGrenadaGuatemalaHeavily indebted poor countries (HIPC)High incomeHondurasHong Kong SAR, ChinaHungaryIBRD onlyIcelandIDA & IBRD totalIDA onlyIDA totalIndiaIndonesiaIran, Islamic Rep.IraqIrelandIsraelItalyJamaicaJapanJordanKazakhstanKenyaKiribatiKorea, Rep.KuwaitKyrgyz RepublicLao PDRLate-demographic dividendLatin America & Caribbean Latin America & Caribbean (excluding high income)Latin America & the Caribbean (IDA & IBRD countries)LatviaLeast developed countries: UN classificationLebanonLesothoLithuaniaLow & middle incomeLow incomeLower middle incomeLuxembourgMacao SAR, ChinaMacedonia, FYRMadagascarMalawiMalaysiaMaldivesMaliMaltaMauritiusMicronesia, Fed. Sts.Middle East & North AfricaMiddle East & North Africa (excluding high income)Middle East & North Africa (IDA & IBRD countries)Middle incomeMoldovaMongoliaMoroccoMozambiqueNamibiaNepalNetherlandsNew ZealandNicaraguaNorth AmericaNorwayOECD membersOmanOther small statesPakistanPanamaPapua New GuineaParaguayPeruPhilippinesPolandPortugalPost-demographic dividendPre-demographic dividendQatarRomaniaRussian FederationRwandaSamoaSan MarinoSao Tome and PrincipeSerbiaSeychellesSierra LeoneSlovak RepublicSloveniaSmall statesSolomon IslandsSouth AfricaSouth AsiaSouth Asia (IDA & IBRD)SpainSri LankaSub-Saharan Africa Sub-Saharan Africa (excluding high income)Sub-Saharan Africa (IDA & IBRD countries)SurinameSwazilandSwedenSwitzerlandTajikistanTanzaniaThailandTimor-LesteTogoTrinidad and TobagoTunisiaTurkeyUgandaUkraineUnited Arab EmiratesUnited KingdomUnited StatesUpper middle incomeUruguayVanuatuVenezuela, RBWest Bank and GazaWorldYemen, Rep.Zambia

Linha do tempo:

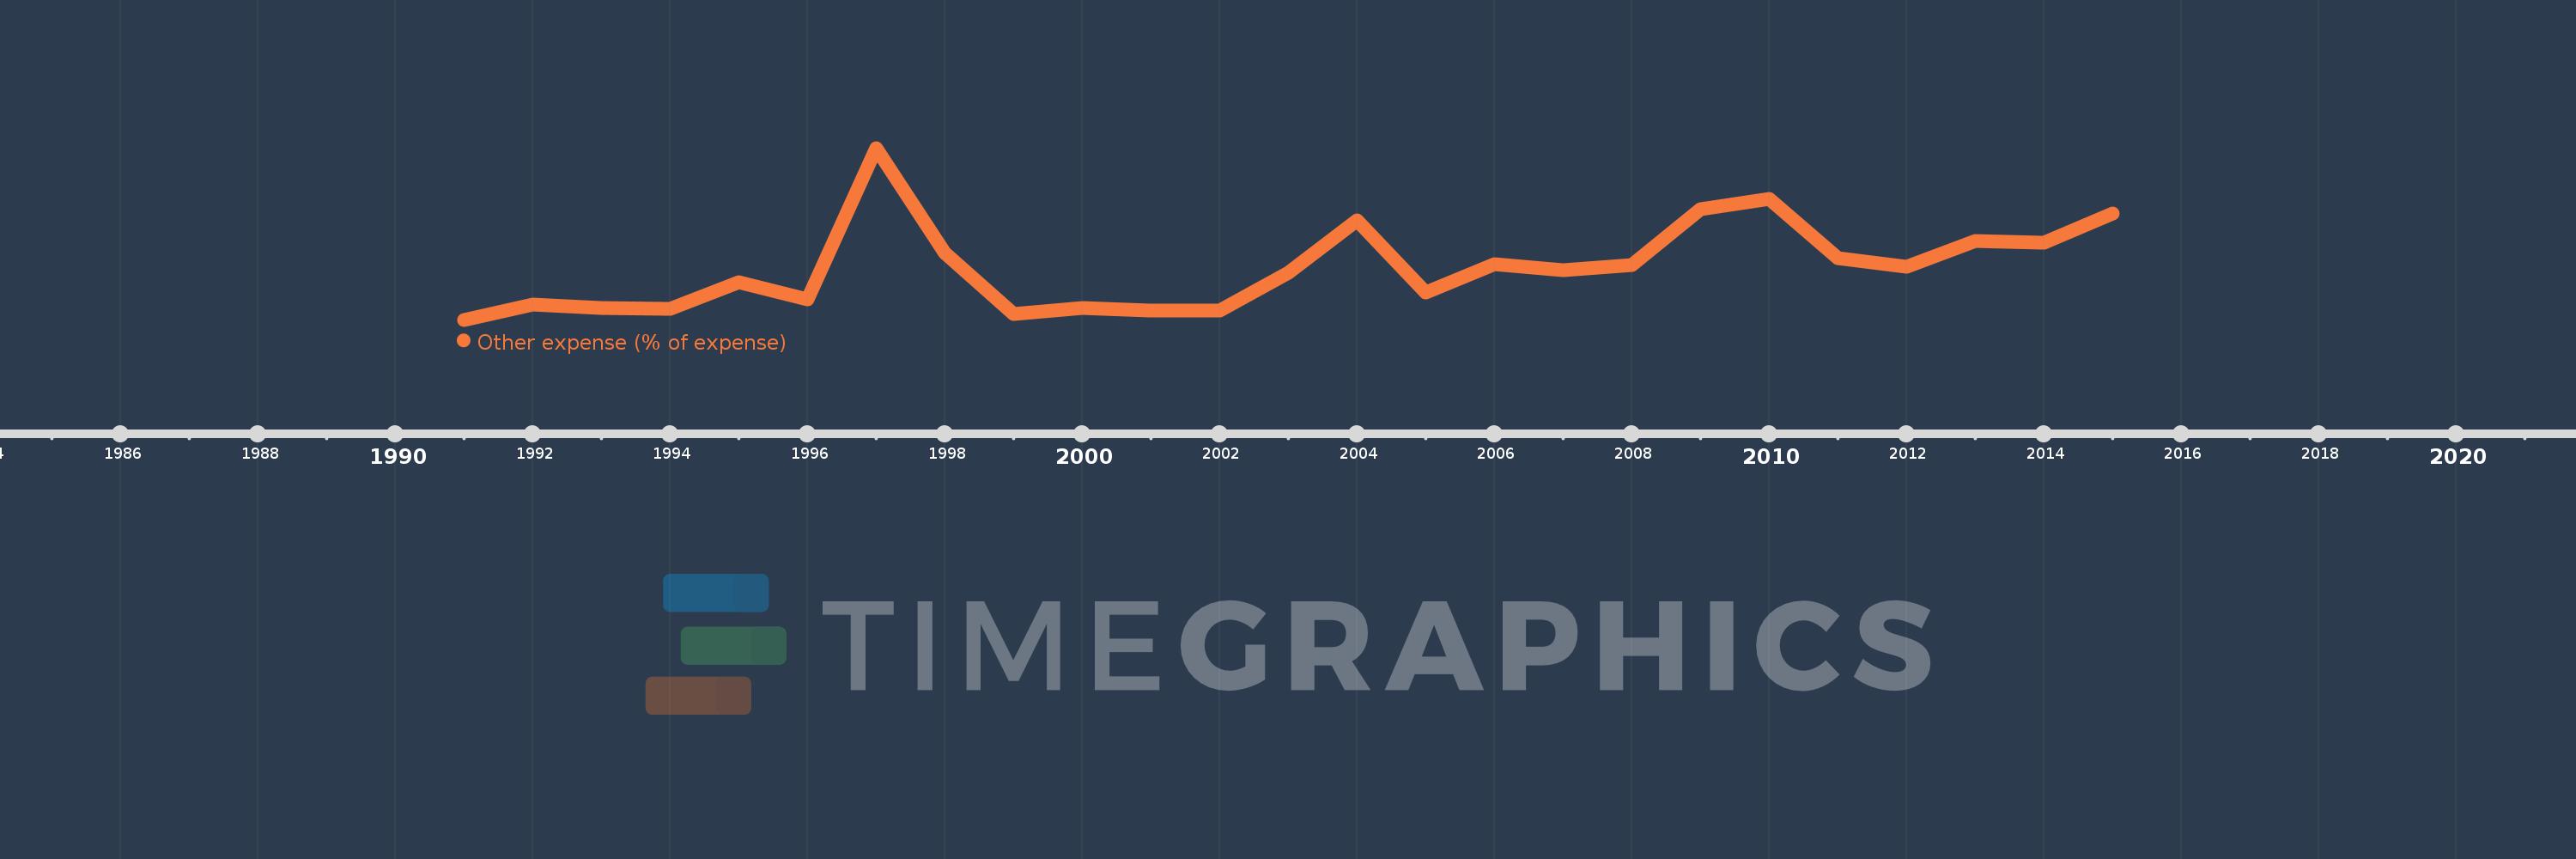
Nesta escala de tempo está apresentado um gráfico de 1991 ano até 2015 ano Bhutan. Dados de 1990 ano ausente. O número de observações reais por data: 25.

Fonte (nome):

Indicadores de desenvolvimento mundial

Fonte (organização):

International Monetary Fund, Government Finance Statistics Yearbook and data files.

Categorias:

Public Sector

Foi atualizado:

23 abr 2017 ano

Indicadores de alterações dos valores ao longo dos anos

Em média:
8.25
Mínimo:
0.982
1 jan 1991 ano
Máximo:
24.774
1 jan 1997 ano
Na data de observação
Valor
Mudança absoluta
A alteração em relação ao valor anterior
1 jan 1991 ano
0.982
+0.982
0.0%
1 jan 1992 ano
3.133
+2.15
218.9%
1 jan 1993 ano
2.587
-0.546
-17.42%
1 jan 1994 ano
2.461
-0.126
-4.88%
1 jan 1995 ano
6.205
+3.744
152.17%
1 jan 1996 ano
3.755
-2.45
-39.48%
1 jan 1997 ano
24.774
+21.019
559.69%
1 jan 1998 ano
10.22
-14.555
-58.75%
1 jan 1999 ano
1.764
-8.455
-82.73%
1 jan 2000 ano
2.644
+0.879
49.82%
1 jan 2001 ano
2.229
-0.415
-15.68%
1 jan 2002 ano
2.244
+0.015
0.66%
1 jan 2003 ano
7.441
+5.198
231.67%
1 jan 2004 ano
14.746
+7.305
98.16%
1 jan 2005 ano
4.807
-9.939
-67.4%
1 jan 2006 ano
8.669
+3.862
80.35%
1 jan 2007 ano
7.846
-0.823
-9.5%
1 jan 2008 ano
8.543
+0.697
8.88%
1 jan 2009 ano
16.349
+7.806
91.37%
1 jan 2010 ano
17.768
+1.419
8.68%
1 jan 2011 ano
9.531
-8.236
-46.35%
1 jan 2012 ano
8.357
-1.174
-12.32%
1 jan 2013 ano
11.892
+3.535
42.3%
1 jan 2014 ano
11.601
-0.291
-2.45%
1 jan 2015 ano
15.704
+4.103
35.37%

Classificação de países por estatísticas atuais por anos