29
/pt/
pt
AIzaSyAYiBZKx7MnpbEhh9jyipgxe19OcubqV5w
April 1, 2024
85693
Bhutan
BTN
true
2
1
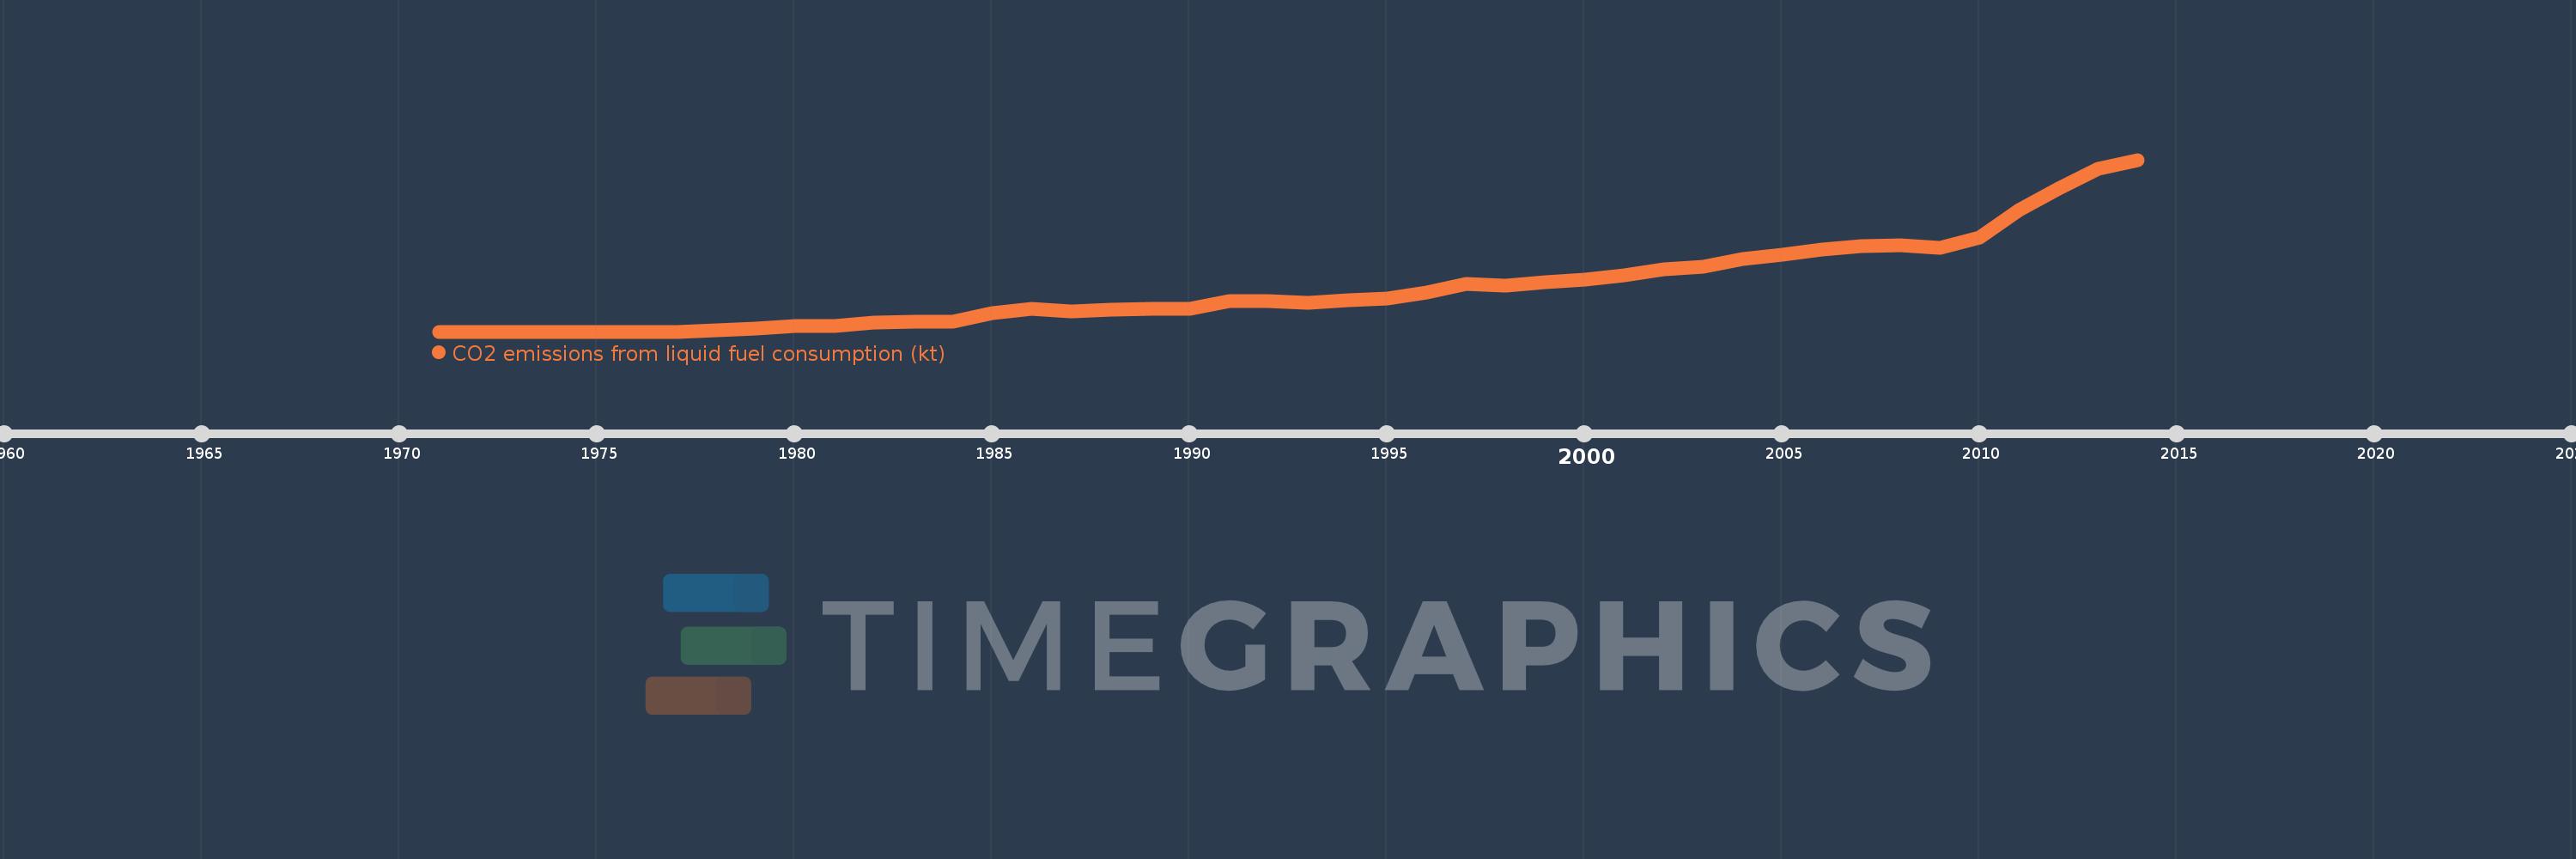
CO2 emissions from liquid fuel consumption (kt)
2014,2013,2012,2011,2010,2009,2008,2007,2006,2005,2004,2003,2002,2001,2000,1999,1998,1997,1996,1995,1994,1993,1992,1991,1990,1989,1988,1987,1986,1985,1984,1983,1982,1981,1980,1979,1978,1977,1976,1975,1974,1973,1972,1971
Estas estatísticas em outros países:
AfghanistanAlbaniaAlgeriaAndorraAngolaAntigua and BarbudaArab WorldArgentinaArmeniaArubaAustraliaAustriaAzerbaijanBahamas, TheBahrainBangladeshBarbadosBelarusBelgiumBelizeBeninBermudaBhutanBoliviaBosnia and HerzegovinaBotswanaBrazilBritish Virgin IslandsBrunei DarussalamBulgariaBurkina FasoBurundiCabo VerdeCambodiaCameroonCanadaCaribbean small statesCayman IslandsCentral African RepublicCentral Europe and the BalticsChadChileChinaColombiaComorosCongo, Dem. Rep.Congo, Rep.Costa RicaCote d'IvoireCroatiaCubaCuracaoCyprusCzech RepublicDenmarkDjiboutiDominicaDominican RepublicEarly-demographic dividendEast Asia & PacificEast Asia & Pacific (excluding high income)East Asia & Pacific (IDA & IBRD countries)EcuadorEgypt, Arab Rep.El SalvadorEquatorial GuineaEritreaEstoniaEthiopiaEuro areaEurope & Central AsiaEurope & Central Asia (excluding high income)Europe & Central Asia (IDA & IBRD countries)European UnionFaroe IslandsFijiFinlandFragile and conflict affected situationsFranceFrench PolynesiaGabonGambia, TheGeorgiaGermanyGhanaGibraltarGreeceGreenlandGrenadaGuatemalaGuineaGuinea-BissauGuyanaHaitiHeavily indebted poor countries (HIPC)High incomeHondurasHong Kong SAR, ChinaHungaryIBRD onlyIcelandIDA & IBRD totalIDA blendIDA onlyIDA totalIndiaIndonesiaIran, Islamic Rep.IraqIrelandIsraelItalyJamaicaJapanJordanKazakhstanKenyaKiribatiKorea, Dem. People’s Rep.Korea, Rep.KuwaitKyrgyz RepublicLao PDRLate-demographic dividendLatin America & Caribbean Latin America & Caribbean (excluding high income)Latin America & the Caribbean (IDA & IBRD countries)LatviaLeast developed countries: UN classificationLebanonLesothoLiberiaLibyaLiechtensteinLithuaniaLow & middle incomeLow incomeLower middle incomeLuxembourgMacao SAR, ChinaMacedonia, FYRMadagascarMalawiMalaysiaMaldivesMaliMaltaMarshall IslandsMauritaniaMauritiusMexicoMicronesia, Fed. Sts.Middle East & North AfricaMiddle East & North Africa (excluding high income)Middle East & North Africa (IDA & IBRD countries)Middle incomeMoldovaMongoliaMontenegroMoroccoMozambiqueMyanmarNamibiaNauruNepalNetherlandsNew CaledoniaNew ZealandNicaraguaNigerNigeriaNorth AmericaNorwayOECD membersOmanOther small statesPacific island small statesPakistanPalauPanamaPapua New GuineaParaguayPeruPhilippinesPolandPortugalPost-demographic dividendPre-demographic dividendQatarRomaniaRussian FederationRwandaSamoaSao Tome and PrincipeSaudi ArabiaSenegalSerbiaSeychellesSierra LeoneSingaporeSint Maarten (Dutch part)Slovak RepublicSloveniaSmall statesSolomon IslandsSomaliaSouth AfricaSouth AsiaSouth Asia (IDA & IBRD)South SudanSpainSri LankaSt. Kitts and NevisSt. LuciaSt. Vincent and the GrenadinesSub-Saharan Africa Sub-Saharan Africa (excluding high income)Sub-Saharan Africa (IDA & IBRD countries)SudanSurinameSwazilandSwedenSwitzerlandSyrian Arab RepublicTajikistanTanzaniaThailandTimor-LesteTogoTongaTrinidad and TobagoTunisiaTurkeyTurkmenistanTurks and Caicos IslandsUgandaUkraineUnited Arab EmiratesUnited KingdomUnited StatesUpper middle incomeUruguayUzbekistanVanuatuVenezuela, RBVietnamWest Bank and GazaWorldYemen, Rep.ZambiaZimbabwe Linha do tempo:
Nesta escala de tempo está apresentado um gráfico de 1971 ano até 2014 ano Bhutan. Dados de 1970 ano ausente. O número de observações reais por data: 44.
Fonte (nome):
Indicadores de desenvolvimento mundial
Fonte (organização):
Carbon Dioxide Information Analysis Center, Environmental Sciences Division, Oak Ridge National Laboratory, Tennessee, United States.
Categorias:
Energy & Mining, Climate Change, Environment
Foi atualizado:
23 abr 2017 ano
Indicadores de alterações dos valores ao longo dos anos
Mínimo:
3.667
1 jan 1971 ano
Máximo:
440.04
1 jan 2014 ano
Na data de observação
Valor
Mudança absoluta
A alteração em relação ao valor anterior
1 jan 1971 ano
3.667
+3.667
0.0%
1 jan 1972 ano
3.667
0.0
0.0%
1 jan 1973 ano
3.667
0.0
0.0%
1 jan 1974 ano
3.667
0.0
0.0%
1 jan 1975 ano
3.667
0.0
0.0%
1 jan 1976 ano
3.667
0.0
0.0%
1 jan 1977 ano
3.667
0.0
0.0%
1 jan 1978 ano
7.334
+3.667
100.0%
1 jan 1979 ano
11.001
+3.667
50.0%
1 jan 1980 ano
18.335
+7.334
66.67%
1 jan 1981 ano
18.335
0.0
0.0%
1 jan 1982 ano
25.669
+7.334
40.0%
1 jan 1983 ano
29.336
+3.667
14.29%
1 jan 1984 ano
29.336
0.0
0.0%
1 jan 1985 ano
51.338
+22.002
75.0%
1 jan 1986 ano
62.339
+11.001
21.43%
1 jan 1987 ano
55.005
-7.334
-11.76%
1 jan 1988 ano
58.672
+3.667
6.67%
1 jan 1989 ano
62.339
+3.667
6.25%
1 jan 1990 ano
62.339
0.0
0.0%
1 jan 1991 ano
80.674
+18.335
29.41%
1 jan 1992 ano
80.674
0.0
0.0%
1 jan 1993 ano
77.007
-3.667
-4.55%
1 jan 1994 ano
84.341
+7.334
9.52%
1 jan 1995 ano
88.008
+3.667
4.35%
1 jan 1996 ano
102.676
+14.668
16.67%
1 jan 1997 ano
124.678
+22.002
21.43%
1 jan 1998 ano
121.011
-3.667
-2.94%
1 jan 1999 ano
128.345
+7.334
6.06%
1 jan 2000 ano
135.679
+7.334
5.71%
1 jan 2001 ano
146.68
+11.001
8.11%
1 jan 2002 ano
161.348
+14.668
10.0%
1 jan 2003 ano
168.682
+7.334
4.55%
1 jan 2004 ano
187.017
+18.335
10.87%
1 jan 2005 ano
198.018
+11.001
5.88%
1 jan 2006 ano
212.686
+14.668
7.41%
1 jan 2007 ano
220.02
+7.334
3.45%
1 jan 2008 ano
223.687
+3.667
1.67%
1 jan 2009 ano
216.353
-7.334
-3.28%
1 jan 2010 ano
242.022
+25.669
11.86%
1 jan 2011 ano
311.695
+69.673
28.79%
1 jan 2012 ano
366.7
+55.005
17.65%
1 jan 2013 ano
418.038
+51.338
14.0%
1 jan 2014 ano
440.04
+22.002
5.26%
Classificação de países por estatísticas atuais por anos


Comentários: