29
/pt/
pt
AIzaSyAYiBZKx7MnpbEhh9jyipgxe19OcubqV5w
April 1, 2024
82220
Belgium
BEL
true
2
1
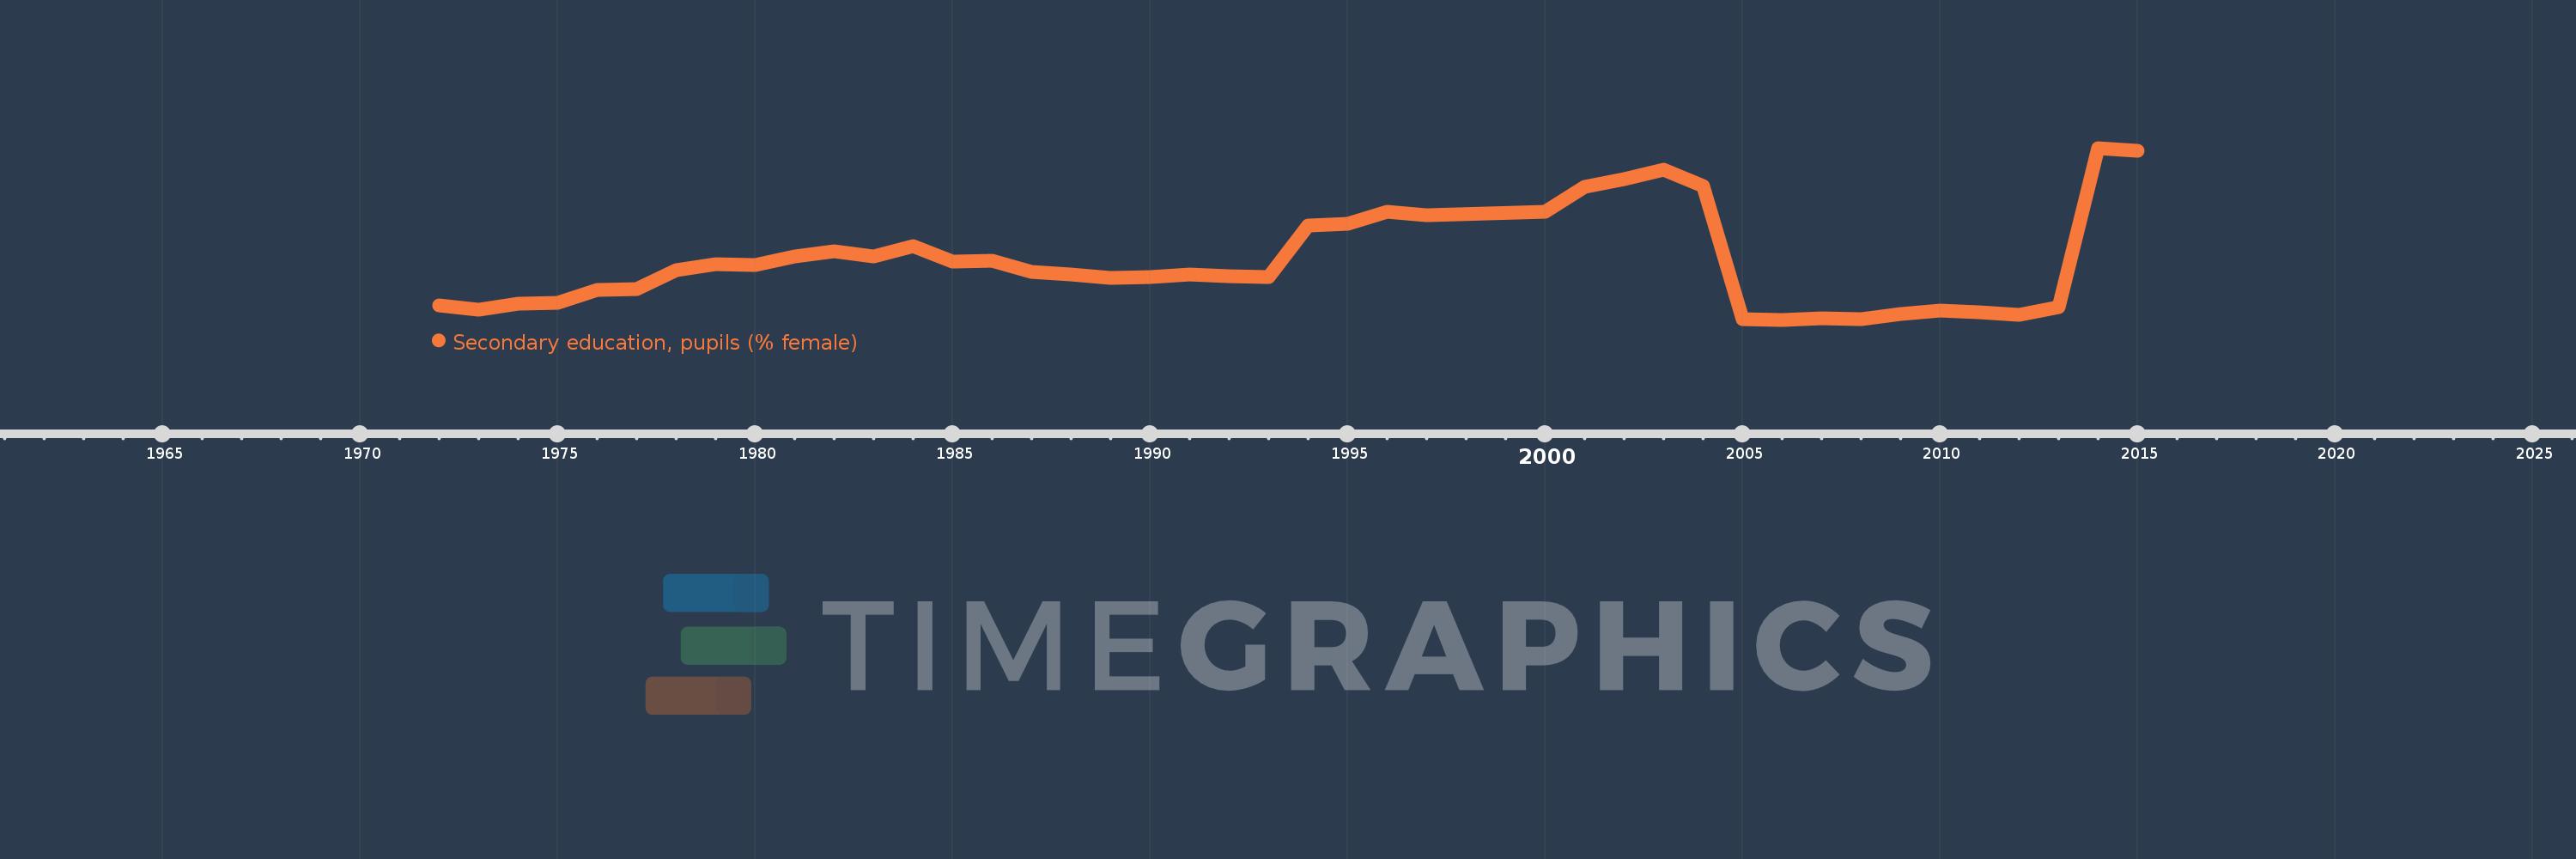
Secondary education, pupils (% female)
2015,2014,2013,2012,2011,2010,2009,2008,2007,2006,2005,2004,2003,2002,2001,2000,1997,1996,1995,1994,1993,1992,1991,1990,1989,1988,1987,1986,1985,1984,1983,1982,1981,1980,1979,1978,1977,1976,1975,1974,1973,1972
Estas estatísticas em outros países:
AfghanistanAlbaniaAlgeriaAndorraAngolaAntigua and BarbudaArab WorldArgentinaArmeniaArubaAustraliaAustriaAzerbaijanBahamas, TheBahrainBangladeshBarbadosBelarusBelgiumBelizeBeninBermudaBhutanBoliviaBosnia and HerzegovinaBotswanaBrazilBritish Virgin IslandsBrunei DarussalamBulgariaBurkina FasoBurundiCabo VerdeCambodiaCameroonCanadaCaribbean small statesCayman IslandsCentral African RepublicCentral Europe and the BalticsChadChileChinaColombiaComorosCongo, Dem. Rep.Congo, Rep.Costa RicaCote d'IvoireCroatiaCubaCuracaoCyprusCzech RepublicDenmarkDjiboutiDominicaDominican RepublicEarly-demographic dividendEast Asia & PacificEast Asia & Pacific (excluding high income)East Asia & Pacific (IDA & IBRD countries)EcuadorEgypt, Arab Rep.El SalvadorEquatorial GuineaEritreaEstoniaEthiopiaEuro areaEurope & Central AsiaEurope & Central Asia (excluding high income)Europe & Central Asia (IDA & IBRD countries)European UnionFijiFinlandFragile and conflict affected situationsFranceGabonGambia, TheGeorgiaGermanyGhanaGibraltarGreeceGrenadaGuatemalaGuineaGuinea-BissauGuyanaHeavily indebted poor countries (HIPC)High incomeHondurasHong Kong SAR, ChinaHungaryIBRD onlyIcelandIDA & IBRD totalIDA blendIDA onlyIDA totalIndiaIndonesiaIran, Islamic Rep.IraqIrelandIsraelItalyJamaicaJapanJordanKazakhstanKenyaKiribatiKorea, Dem. People’s Rep.Korea, Rep.KuwaitKyrgyz RepublicLao PDRLate-demographic dividendLatin America & Caribbean Latin America & Caribbean (excluding high income)Latin America & the Caribbean (IDA & IBRD countries)LatviaLeast developed countries: UN classificationLebanonLesothoLiberiaLibyaLiechtensteinLithuaniaLow & middle incomeLow incomeLower middle incomeLuxembourgMacao SAR, ChinaMacedonia, FYRMadagascarMalawiMalaysiaMaldivesMaliMaltaMarshall IslandsMauritaniaMauritiusMexicoMicronesia, Fed. Sts.Middle East & North AfricaMiddle East & North Africa (excluding high income)Middle East & North Africa (IDA & IBRD countries)Middle incomeMoldovaMonacoMongoliaMontenegroMoroccoMozambiqueMyanmarNamibiaNauruNepalNetherlandsNew ZealandNicaraguaNigerNigeriaNorth AmericaNorwayOECD membersOmanOther small statesPacific island small statesPakistanPalauPanamaPapua New GuineaParaguayPeruPhilippinesPolandPortugalPost-demographic dividendPre-demographic dividendPuerto RicoQatarRomaniaRussian FederationRwandaSamoaSan MarinoSao Tome and PrincipeSaudi ArabiaSenegalSerbiaSeychellesSierra LeoneSingaporeSint Maarten (Dutch part)Slovak RepublicSloveniaSmall statesSolomon IslandsSomaliaSouth AfricaSouth AsiaSouth Asia (IDA & IBRD)SpainSri LankaSt. Kitts and NevisSt. LuciaSt. Vincent and the GrenadinesSub-Saharan Africa Sub-Saharan Africa (excluding high income)Sub-Saharan Africa (IDA & IBRD countries)SudanSurinameSwazilandSwedenSwitzerlandSyrian Arab RepublicTajikistanTanzaniaThailandTimor-LesteTogoTongaTrinidad and TobagoTunisiaTurkeyTurkmenistanTurks and Caicos IslandsTuvaluUgandaUkraineUnited Arab EmiratesUnited KingdomUnited StatesUpper middle incomeUruguayUzbekistanVanuatuVenezuela, RBVietnamWest Bank and GazaWorldYemen, Rep.ZambiaZimbabwe Linha do tempo:
Nesta escala de tempo está apresentado um gráfico de 1972 ano até 2015 ano Belgium. Dados de 1971 ano ausente. O número de observações reais por data: 42.
Fonte (nome):
Indicadores de desenvolvimento mundial
Fonte (organização):
United Nations Educational, Scientific, and Cultural Organization (UNESCO) Institute for Statistics.
Categorias:
Education, Gender
Foi atualizado:
23 abr 2017 ano
Indicadores de alterações dos valores ao longo dos anos
Mínimo:
48.02
1 jan 2006 ano
Máximo:
52.17
1 jan 2014 ano
Na data de observação
Valor
Mudança absoluta
A alteração em relação ao valor anterior
1 jan 1972 ano
48.367
+48.367
0.0%
1 jan 1973 ano
48.262
-0.106
-0.22%
1 jan 1974 ano
48.413
+0.152
0.31%
1 jan 1975 ano
48.437
+0.023
0.05%
1 jan 1976 ano
48.742
+0.305
0.63%
1 jan 1977 ano
48.767
+0.026
0.05%
1 jan 1978 ano
49.224
+0.457
0.94%
1 jan 1979 ano
49.361
+0.137
0.28%
1 jan 1980 ano
49.347
-0.014
-0.03%
1 jan 1981 ano
49.559
+0.212
0.43%
1 jan 1982 ano
49.682
+0.123
0.25%
1 jan 1983 ano
49.541
-0.141
-0.28%
1 jan 1984 ano
49.788
+0.247
0.5%
1 jan 1985 ano
49.415
-0.373
-0.75%
1 jan 1986 ano
49.446
+0.031
0.06%
1 jan 1987 ano
49.17
-0.276
-0.56%
1 jan 1988 ano
49.109
-0.061
-0.12%
1 jan 1989 ano
49.039
-0.069
-0.14%
1 jan 1990 ano
49.045
+0.006
0.01%
1 jan 1991 ano
49.121
+0.075
0.15%
1 jan 1992 ano
49.071
-0.05
-0.1%
1 jan 1993 ano
49.044
-0.026
-0.05%
1 jan 1994 ano
50.298
+1.254
2.56%
1 jan 1995 ano
50.337
+0.039
0.08%
1 jan 1996 ano
50.638
+0.301
0.6%
1 jan 1997 ano
50.55
-0.088
-0.17%
1 jan 2000 ano
50.63
+0.08
0.16%
1 jan 2001 ano
51.232
+0.602
1.19%
1 jan 2002 ano
51.426
+0.193
0.38%
1 jan 2003 ano
51.642
+0.216
0.42%
1 jan 2004 ano
51.26
-0.382
-0.74%
1 jan 2005 ano
48.032
-3.228
-6.3%
1 jan 2006 ano
48.02
-0.012
-0.03%
1 jan 2007 ano
48.054
+0.035
0.07%
1 jan 2008 ano
48.03
-0.024
-0.05%
1 jan 2009 ano
48.154
+0.124
0.26%
1 jan 2010 ano
48.237
+0.083
0.17%
1 jan 2011 ano
48.202
-0.036
-0.07%
1 jan 2012 ano
48.134
-0.067
-0.14%
1 jan 2013 ano
48.319
+0.185
0.38%
1 jan 2014 ano
52.17
+3.851
7.97%
1 jan 2015 ano
52.107
-0.063
-0.12%
Classificação de países por estatísticas atuais por anos


Comentários: