29
/pt/
pt
AIzaSyAYiBZKx7MnpbEhh9jyipgxe19OcubqV5w
April 1, 2024
81562
Belgium
BEL
true
2
1
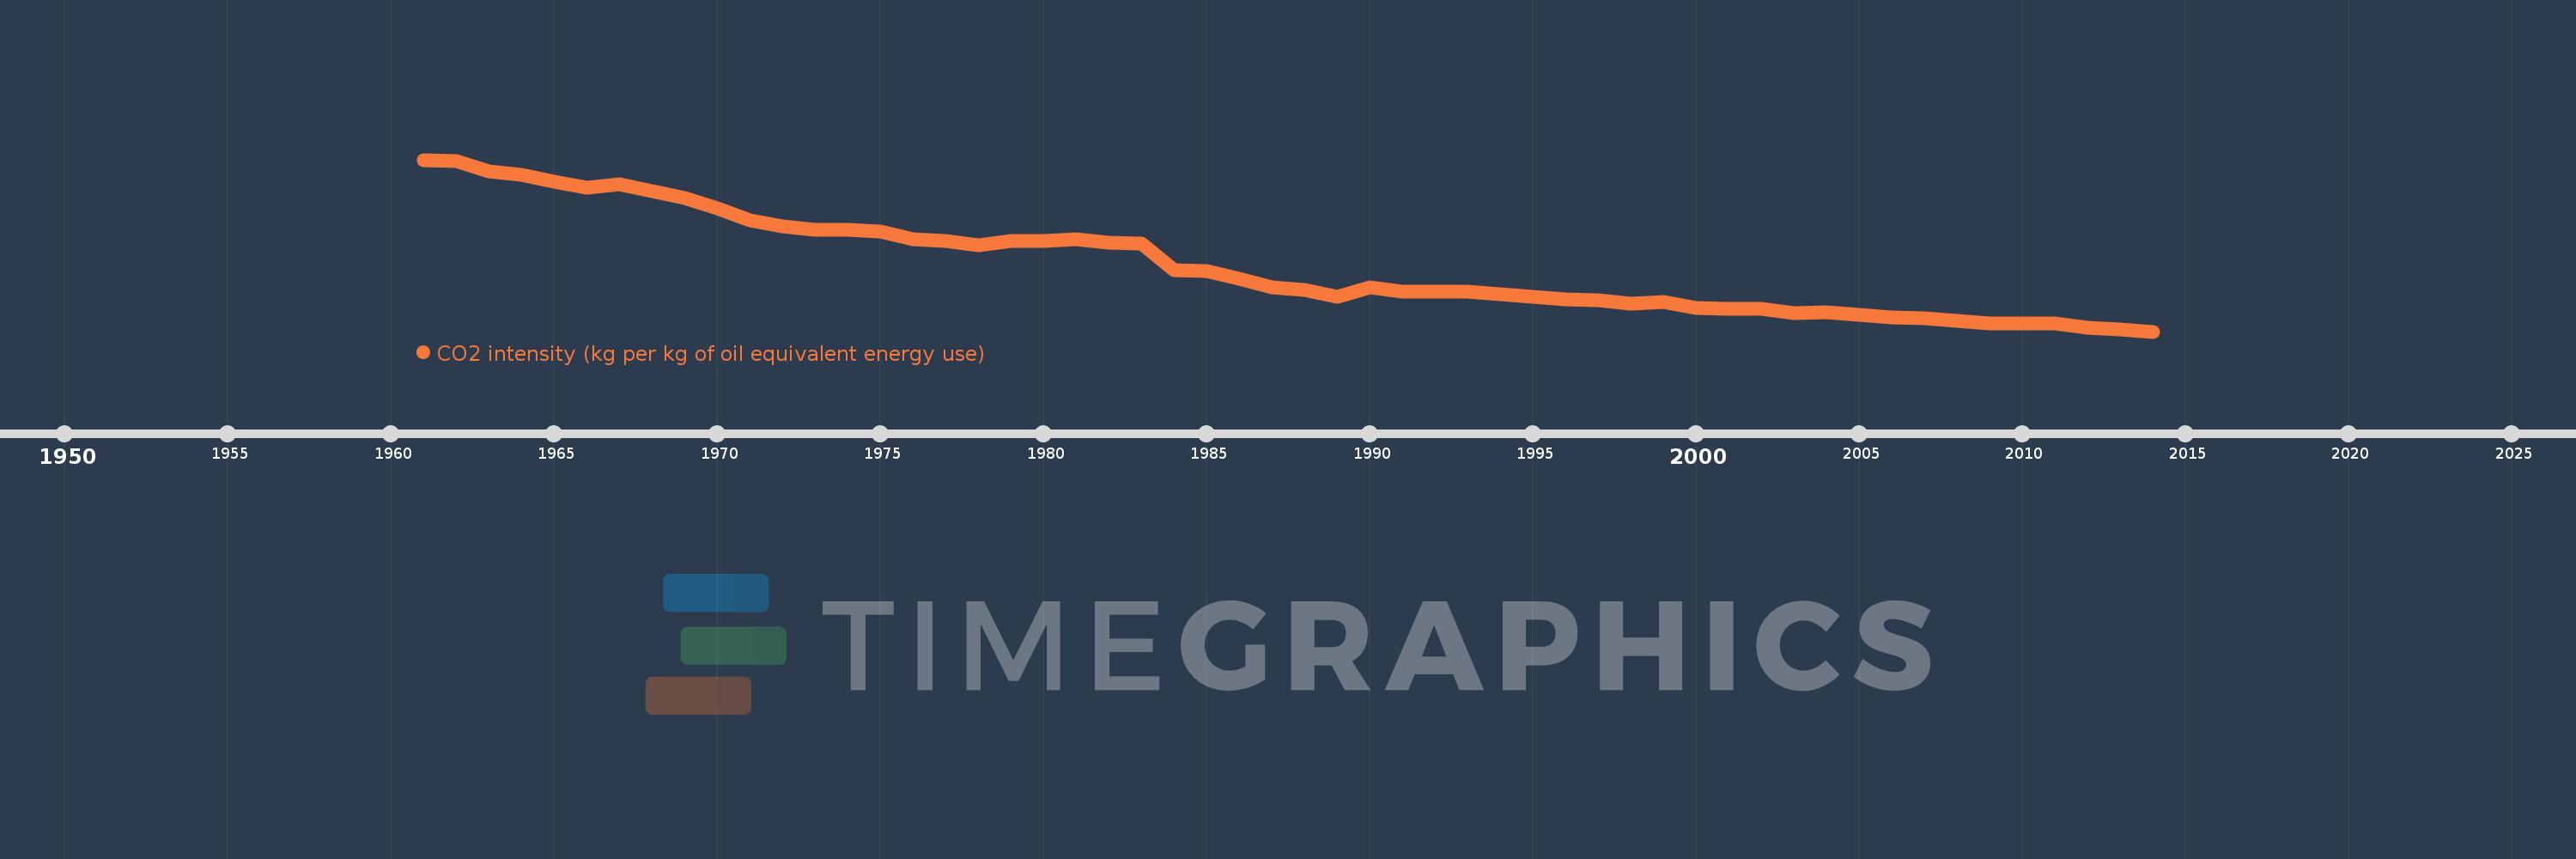
CO2 intensity (kg per kg of oil equivalent energy use)
2014,2013,2012,2011,2010,2009,2008,2007,2006,2005,2004,2003,2002,2001,2000,1999,1998,1997,1996,1995,1994,1993,1992,1991,1990,1989,1988,1987,1986,1985,1984,1983,1982,1981,1980,1979,1978,1977,1976,1975,1974,1973,1972,1971,1970,1969,1968,1967,1966,1965,1964,1963,1962,1961
Estas estatísticas em outros países:
AlbaniaAlgeriaAngolaAntigua and BarbudaArab WorldArgentinaArmeniaAustraliaAustriaAzerbaijanBahamas, TheBahrainBangladeshBarbadosBelarusBelgiumBelizeBeninBhutanBoliviaBosnia and HerzegovinaBotswanaBrazilBrunei DarussalamBulgariaCabo VerdeCambodiaCameroonCanadaCaribbean small statesCentral Europe and the BalticsChileChinaColombiaComorosCongo, Dem. Rep.Congo, Rep.Costa RicaCote d'IvoireCroatiaCubaCuracaoCyprusCzech RepublicDenmarkDjiboutiDominicaDominican RepublicEarly-demographic dividendEast Asia & PacificEast Asia & Pacific (excluding high income)East Asia & Pacific (IDA & IBRD countries)EcuadorEgypt, Arab Rep.El SalvadorEquatorial GuineaEritreaEstoniaEthiopiaEuro areaEurope & Central AsiaEurope & Central Asia (excluding high income)Europe & Central Asia (IDA & IBRD countries)European UnionFijiFinlandFragile and conflict affected situationsFranceGabonGambia, TheGeorgiaGermanyGhanaGibraltarGreeceGrenadaGuatemalaGuinea-BissauGuyanaHaitiHeavily indebted poor countries (HIPC)High incomeHondurasHong Kong SAR, ChinaHungaryIBRD onlyIcelandIDA & IBRD totalIDA blendIDA onlyIDA totalIndiaIndonesiaIran, Islamic Rep.IraqIrelandIsraelItalyJamaicaJapanJordanKazakhstanKenyaKiribatiKorea, Dem. People’s Rep.Korea, Rep.KuwaitKyrgyz RepublicLate-demographic dividendLatin America & Caribbean Latin America & Caribbean (excluding high income)Latin America & the Caribbean (IDA & IBRD countries)LatviaLeast developed countries: UN classificationLebanonLesothoLibyaLithuaniaLow & middle incomeLow incomeLower middle incomeLuxembourgMacedonia, FYRMalaysiaMaldivesMaltaMarshall IslandsMauritiusMexicoMiddle East & North AfricaMiddle East & North Africa (excluding high income)Middle East & North Africa (IDA & IBRD countries)Middle incomeMoldovaMongoliaMontenegroMoroccoMozambiqueMyanmarNamibiaNepalNetherlandsNew ZealandNicaraguaNigerNigeriaNorth AmericaNorwayOECD membersOmanOther small statesPacific island small statesPakistanPalauPanamaParaguayPeruPhilippinesPolandPortugalPost-demographic dividendPre-demographic dividendQatarRomaniaRussian FederationSamoaSao Tome and PrincipeSaudi ArabiaSenegalSerbiaSeychellesSingaporeSlovak RepublicSloveniaSmall statesSolomon IslandsSouth AfricaSouth AsiaSouth Asia (IDA & IBRD)South SudanSpainSri LankaSt. Kitts and NevisSt. LuciaSt. Vincent and the GrenadinesSub-Saharan Africa Sub-Saharan Africa (excluding high income)Sub-Saharan Africa (IDA & IBRD countries)SudanSurinameSwazilandSwedenSwitzerlandSyrian Arab RepublicTajikistanTanzaniaThailandTimor-LesteTogoTongaTrinidad and TobagoTunisiaTurkeyTurkmenistanUkraineUnited Arab EmiratesUnited KingdomUnited StatesUpper middle incomeUruguayUzbekistanVanuatuVenezuela, RBVietnamWorldYemen, Rep.ZambiaZimbabwe Linha do tempo:
Nesta escala de tempo está apresentado um gráfico de 1961 ano até 2014 ano Belgium. Dados de 1960 ano ausente. O número de observações reais por data: 54.
Fonte (nome):
Indicadores de desenvolvimento mundial
Fonte (organização):
Carbon Dioxide Information Analysis Center, Environmental Sciences Division, Oak Ridge National Laboratory, Tennessee, United States.
Categorias:
Climate Change, Environment
Foi atualizado:
23 abr 2017 ano
Indicadores de alterações dos valores ao longo dos anos
Mínimo:
1.661
1 jan 2014 ano
Máximo:
3.946
1 jan 1961 ano
Na data de observação
Valor
Mudança absoluta
A alteração em relação ao valor anterior
1 jan 1961 ano
3.946
+3.946
0.0%
1 jan 1962 ano
3.93
-0.016
-0.4%
1 jan 1963 ano
3.787
-0.143
-3.65%
1 jan 1964 ano
3.742
-0.045
-1.19%
1 jan 1965 ano
3.658
-0.083
-2.23%
1 jan 1966 ano
3.576
-0.083
-2.26%
1 jan 1967 ano
3.619
+0.043
1.21%
1 jan 1968 ano
3.524
-0.095
-2.61%
1 jan 1969 ano
3.433
-0.091
-2.58%
1 jan 1970 ano
3.305
-0.128
-3.72%
1 jan 1971 ano
3.146
-0.159
-4.82%
1 jan 1972 ano
3.064
-0.082
-2.6%
1 jan 1973 ano
3.011
-0.053
-1.73%
1 jan 1974 ano
3.02
+0.008
0.28%
1 jan 1975 ano
2.997
-0.023
-0.76%
1 jan 1976 ano
2.885
-0.111
-3.72%
1 jan 1977 ano
2.865
-0.02
-0.71%
1 jan 1978 ano
2.805
-0.059
-2.07%
1 jan 1979 ano
2.861
+0.055
1.97%
1 jan 1980 ano
2.861
+0.0
0.02%
1 jan 1981 ano
2.893
+0.032
1.12%
1 jan 1982 ano
2.849
-0.044
-1.52%
1 jan 1983 ano
2.834
-0.015
-0.52%
1 jan 1984 ano
2.481
-0.353
-12.46%
1 jan 1985 ano
2.468
-0.013
-0.54%
1 jan 1986 ano
2.369
-0.099
-4.01%
1 jan 1987 ano
2.251
-0.118
-4.96%
1 jan 1988 ano
2.21
-0.041
-1.84%
1 jan 1989 ano
2.124
-0.085
-3.87%
1 jan 1990 ano
2.253
+0.129
6.07%
1 jan 1991 ano
2.196
-0.057
-2.53%
1 jan 1992 ano
2.194
-0.003
-0.12%
1 jan 1993 ano
2.189
-0.005
-0.23%
1 jan 1994 ano
2.155
-0.034
-1.55%
1 jan 1995 ano
2.125
-0.029
-1.37%
1 jan 1996 ano
2.089
-0.036
-1.7%
1 jan 1997 ano
2.081
-0.009
-0.41%
1 jan 1998 ano
2.03
-0.05
-2.41%
1 jan 1999 ano
2.05
+0.019
0.96%
1 jan 2000 ano
1.973
-0.077
-3.77%
1 jan 2001 ano
1.965
-0.007
-0.37%
1 jan 2002 ano
1.959
-0.006
-0.3%
1 jan 2003 ano
1.902
-0.058
-2.95%
1 jan 2004 ano
1.923
+0.021
1.12%
1 jan 2005 ano
1.885
-0.038
-1.98%
1 jan 2006 ano
1.847
-0.038
-2.0%
1 jan 2007 ano
1.84
-0.007
-0.39%
1 jan 2008 ano
1.808
-0.032
-1.73%
1 jan 2009 ano
1.771
-0.037
-2.03%
1 jan 2010 ano
1.766
-0.006
-0.32%
1 jan 2011 ano
1.767
+0.001
0.04%
1 jan 2012 ano
1.717
-0.049
-2.8%
1 jan 2013 ano
1.694
-0.023
-1.33%
1 jan 2014 ano
1.661
-0.033
-1.94%
Classificação de países por estatísticas atuais por anos


Comentários: