29
/pt/
pt
AIzaSyAYiBZKx7MnpbEhh9jyipgxe19OcubqV5w
April 1, 2024
76964
Bahrain
BHR
true
2
1
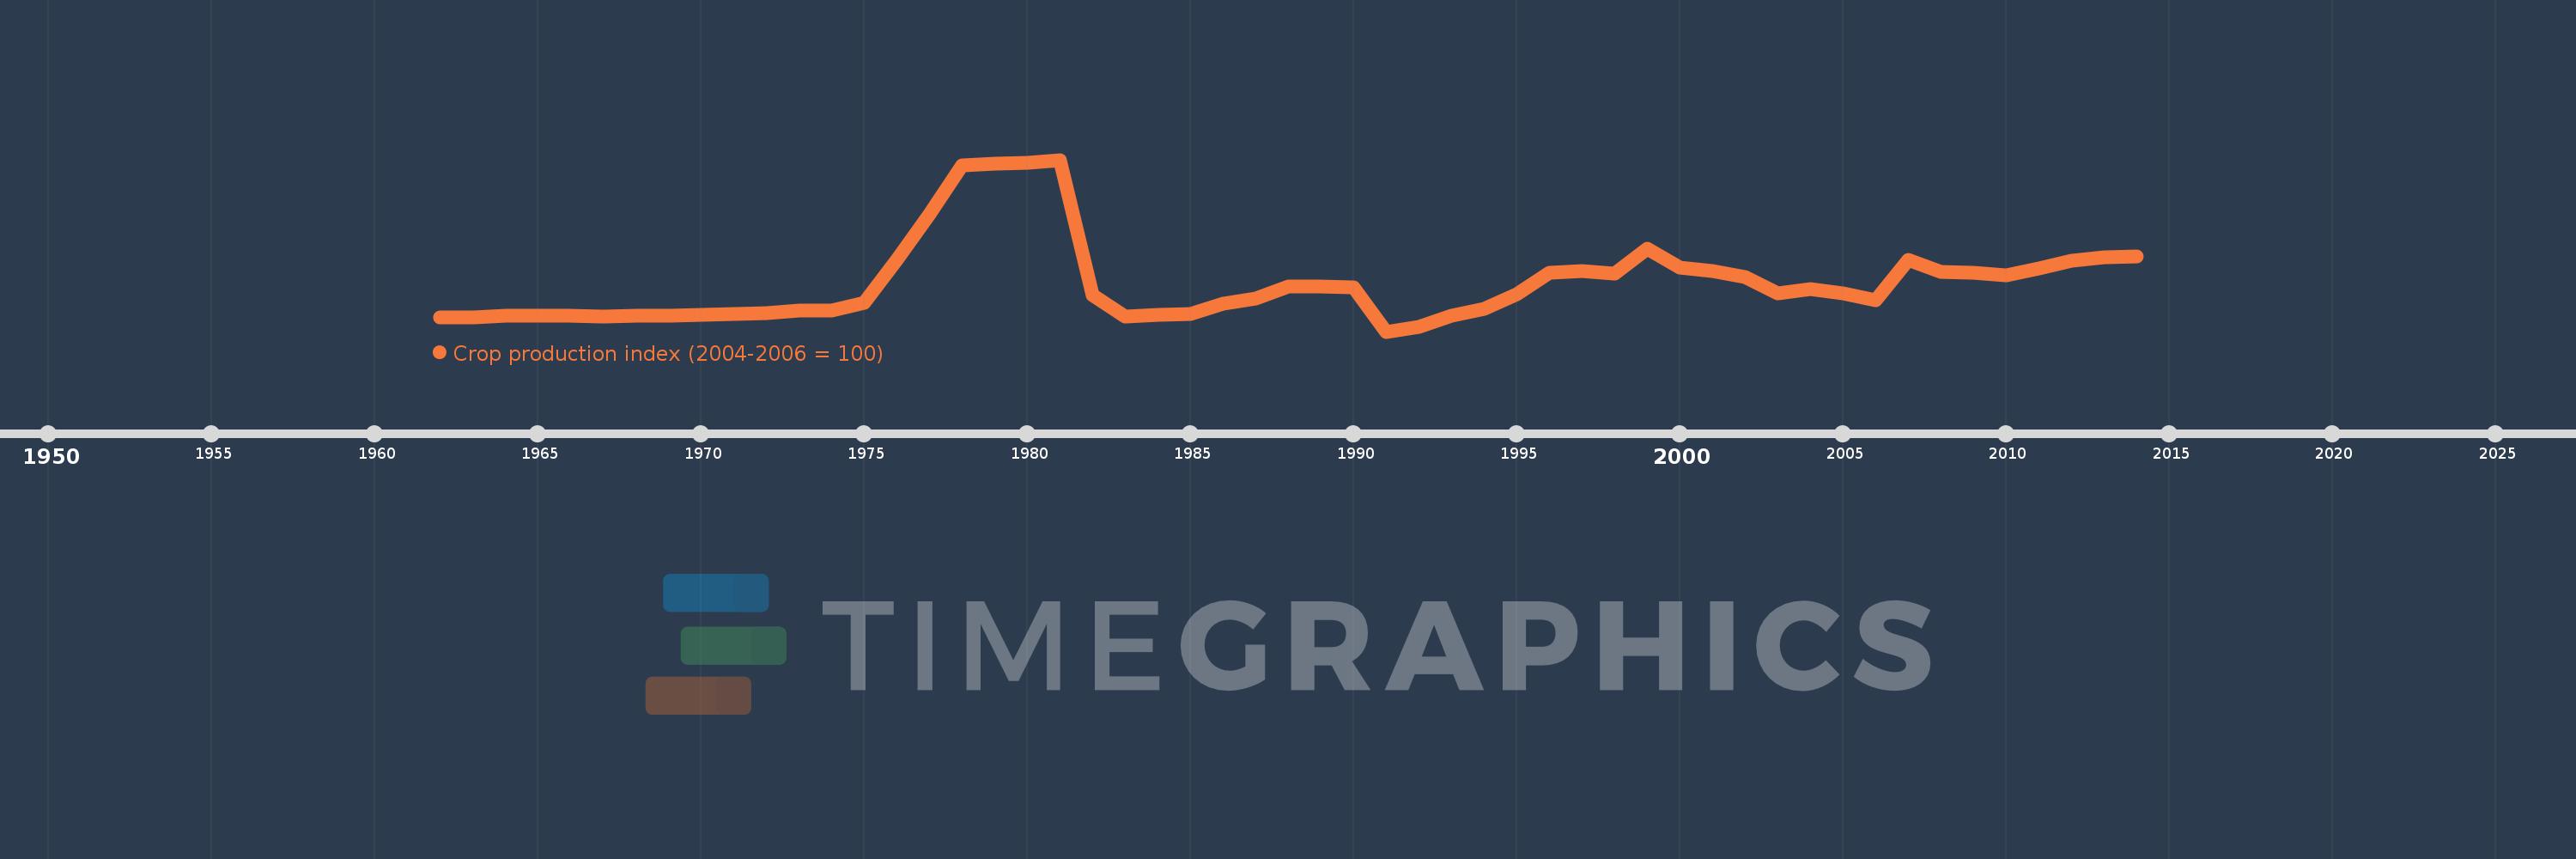
Crop production index (2004-2006 = 100)
2014,2013,2012,2011,2010,2009,2008,2007,2006,2005,2004,2003,2002,2001,2000,1999,1998,1997,1996,1995,1994,1993,1992,1991,1990,1989,1988,1987,1986,1985,1984,1983,1982,1981,1980,1979,1978,1977,1976,1975,1974,1973,1972,1971,1970,1969,1968,1967,1966,1965,1964,1963,1962
Estas estatísticas em outros países:
AfghanistanAlbaniaAlgeriaAmerican SamoaAngolaAntigua and BarbudaArab WorldArgentinaArmeniaAustraliaAustriaAzerbaijanBahamas, TheBahrainBangladeshBarbadosBelarusBelgiumBelizeBeninBermudaBhutanBoliviaBosnia and HerzegovinaBotswanaBrazilBritish Virgin IslandsBrunei DarussalamBulgariaBurkina FasoBurundiCabo VerdeCambodiaCameroonCanadaCaribbean small statesCayman IslandsCentral African RepublicCentral Europe and the BalticsChadChileChinaColombiaComorosCongo, Dem. Rep.Congo, Rep.Costa RicaCote d'IvoireCroatiaCubaCyprusCzech RepublicDenmarkDjiboutiDominicaDominican RepublicEarly-demographic dividendEast Asia & PacificEast Asia & Pacific (excluding high income)East Asia & Pacific (IDA & IBRD countries)EcuadorEgypt, Arab Rep.El SalvadorEquatorial GuineaEritreaEstoniaEthiopiaEuro areaEurope & Central AsiaEurope & Central Asia (excluding high income)Europe & Central Asia (IDA & IBRD countries)European UnionFaroe IslandsFijiFinlandFragile and conflict affected situationsFranceFrench PolynesiaGabonGambia, TheGeorgiaGermanyGhanaGreeceGrenadaGuamGuatemalaGuineaGuinea-BissauGuyanaHaitiHeavily indebted poor countries (HIPC)High incomeHondurasHong Kong SAR, ChinaHungaryIBRD onlyIcelandIDA & IBRD totalIDA blendIDA onlyIDA totalIndiaIndonesiaIran, Islamic Rep.IraqIrelandIsraelItalyJamaicaJapanJordanKazakhstanKenyaKiribatiKorea, Dem. People’s Rep.Korea, Rep.KuwaitKyrgyz RepublicLao PDRLate-demographic dividendLatin America & Caribbean Latin America & Caribbean (excluding high income)Latin America & the Caribbean (IDA & IBRD countries)LatviaLeast developed countries: UN classificationLebanonLesothoLiberiaLibyaLiechtensteinLithuaniaLow & middle incomeLow incomeLower middle incomeLuxembourgMacao SAR, ChinaMacedonia, FYRMadagascarMalawiMalaysiaMaldivesMaliMaltaMarshall IslandsMauritaniaMauritiusMexicoMicronesia, Fed. Sts.Middle East & North AfricaMiddle East & North Africa (excluding high income)Middle East & North Africa (IDA & IBRD countries)Middle incomeMoldovaMongoliaMontenegroMoroccoMozambiqueMyanmarNamibiaNauruNepalNetherlandsNew CaledoniaNew ZealandNicaraguaNigerNigeriaNorth AmericaNorwayOECD membersOmanOther small statesPacific island small statesPakistanPanamaPapua New GuineaParaguayPeruPhilippinesPolandPortugalPost-demographic dividendPre-demographic dividendPuerto RicoQatarRomaniaRussian FederationRwandaSamoaSao Tome and PrincipeSaudi ArabiaSenegalSerbiaSeychellesSierra LeoneSingaporeSlovak RepublicSloveniaSmall statesSolomon IslandsSomaliaSouth AfricaSouth AsiaSouth Asia (IDA & IBRD)SpainSri LankaSt. Kitts and NevisSt. LuciaSt. Vincent and the GrenadinesSub-Saharan Africa Sub-Saharan Africa (excluding high income)Sub-Saharan Africa (IDA & IBRD countries)SudanSurinameSwazilandSwedenSwitzerlandSyrian Arab RepublicTajikistanTanzaniaThailandTimor-LesteTogoTongaTrinidad and TobagoTunisiaTurkeyTurkmenistanTuvaluUgandaUkraineUnited Arab EmiratesUnited KingdomUnited StatesUpper middle incomeUruguayUzbekistanVanuatuVenezuela, RBVietnamWest Bank and GazaWorldYemen, Rep.ZambiaZimbabwe Linha do tempo:
Nesta escala de tempo está apresentado um gráfico de 1962 ano até 2014 ano Bahrain. Dados de 1961 ano ausente. O número de observações reais por data: 53.
Fonte (nome):
Indicadores de desenvolvimento mundial
Fonte (organização):
Food and Agriculture Organization, electronic files and web site.
Categorias:
Agriculture & Rural Development
Foi atualizado:
23 abr 2017 ano
Indicadores de alterações dos valores ao longo dos anos
Mínimo:
61.17
1 jan 1991 ano
Máximo:
203.04
1 jan 1981 ano
Na data de observação
Valor
Mudança absoluta
A alteração em relação ao valor anterior
1 jan 1962 ano
72.97
+72.97
0.0%
1 jan 1963 ano
73.13
+0.16
0.22%
1 jan 1964 ano
74.28
+1.15
1.57%
1 jan 1965 ano
74.28
0.0
0.0%
1 jan 1966 ano
74.5
+0.22
0.3%
1 jan 1967 ano
73.27
-1.23
-1.65%
1 jan 1968 ano
73.97
+0.7
0.96%
1 jan 1969 ano
74.55
+0.58
0.78%
1 jan 1970 ano
75.06
+0.51
0.68%
1 jan 1971 ano
75.99
+0.93
1.24%
1 jan 1972 ano
76.68
+0.69
0.91%
1 jan 1973 ano
78.25
+1.57
2.05%
1 jan 1974 ano
78.25
0.0
0.0%
1 jan 1975 ano
85.09
+6.84
8.74%
1 jan 1976 ano
120.21
+35.12
41.27%
1 jan 1977 ano
157.77
+37.56
31.25%
1 jan 1978 ano
198.78
+41.01
25.99%
1 jan 1979 ano
199.97
+1.19
0.6%
1 jan 1980 ano
200.42
+0.45
0.23%
1 jan 1981 ano
203.04
+2.62
1.31%
1 jan 1982 ano
91.18
-111.86
-55.09%
1 jan 1983 ano
73.34
-17.84
-19.57%
1 jan 1984 ano
74.78
+1.44
1.96%
1 jan 1985 ano
75.88
+1.1
1.47%
1 jan 1986 ano
84.02
+8.14
10.73%
1 jan 1987 ano
88.77
+4.75
5.65%
1 jan 1988 ano
98.15
+9.38
10.57%
1 jan 1989 ano
98.11
-0.04
-0.04%
1 jan 1990 ano
97.94
-0.17
-0.17%
1 jan 1991 ano
61.17
-36.77
-37.54%
1 jan 1992 ano
65.03
+3.86
6.31%
1 jan 1993 ano
74.09
+9.06
13.93%
1 jan 1994 ano
80.07
+5.98
8.07%
1 jan 1995 ano
91.86
+11.79
14.72%
1 jan 1996 ano
109.45
+17.59
19.15%
1 jan 1997 ano
111.3
+1.85
1.69%
1 jan 1998 ano
108.89
-2.41
-2.17%
1 jan 1999 ano
129.57
+20.68
18.99%
1 jan 2000 ano
113.91
-15.66
-12.09%
1 jan 2001 ano
111.12
-2.79
-2.45%
1 jan 2002 ano
106.21
-4.91
-4.42%
1 jan 2003 ano
92.5
-13.71
-12.91%
1 jan 2004 ano
96.12
+3.62
3.91%
1 jan 2005 ano
92.42
-3.7
-3.85%
1 jan 2006 ano
87.07
-5.35
-5.79%
1 jan 2007 ano
120.51
+33.44
38.41%
1 jan 2008 ano
110.59
-9.92
-8.23%
1 jan 2009 ano
109.86
-0.73
-0.66%
1 jan 2010 ano
107.94
-1.92
-1.75%
1 jan 2011 ano
113.14
+5.2
4.82%
1 jan 2012 ano
119.38
+6.24
5.52%
1 jan 2013 ano
122.76
+3.38
2.83%
1 jan 2014 ano
123.39
+0.63
0.51%
Classificação de países por estatísticas atuais por anos


Comentários: