29
/pt/
pt
AIzaSyAYiBZKx7MnpbEhh9jyipgxe19OcubqV5w
April 1, 2024
70545
Argentina
ARG
true
2
1
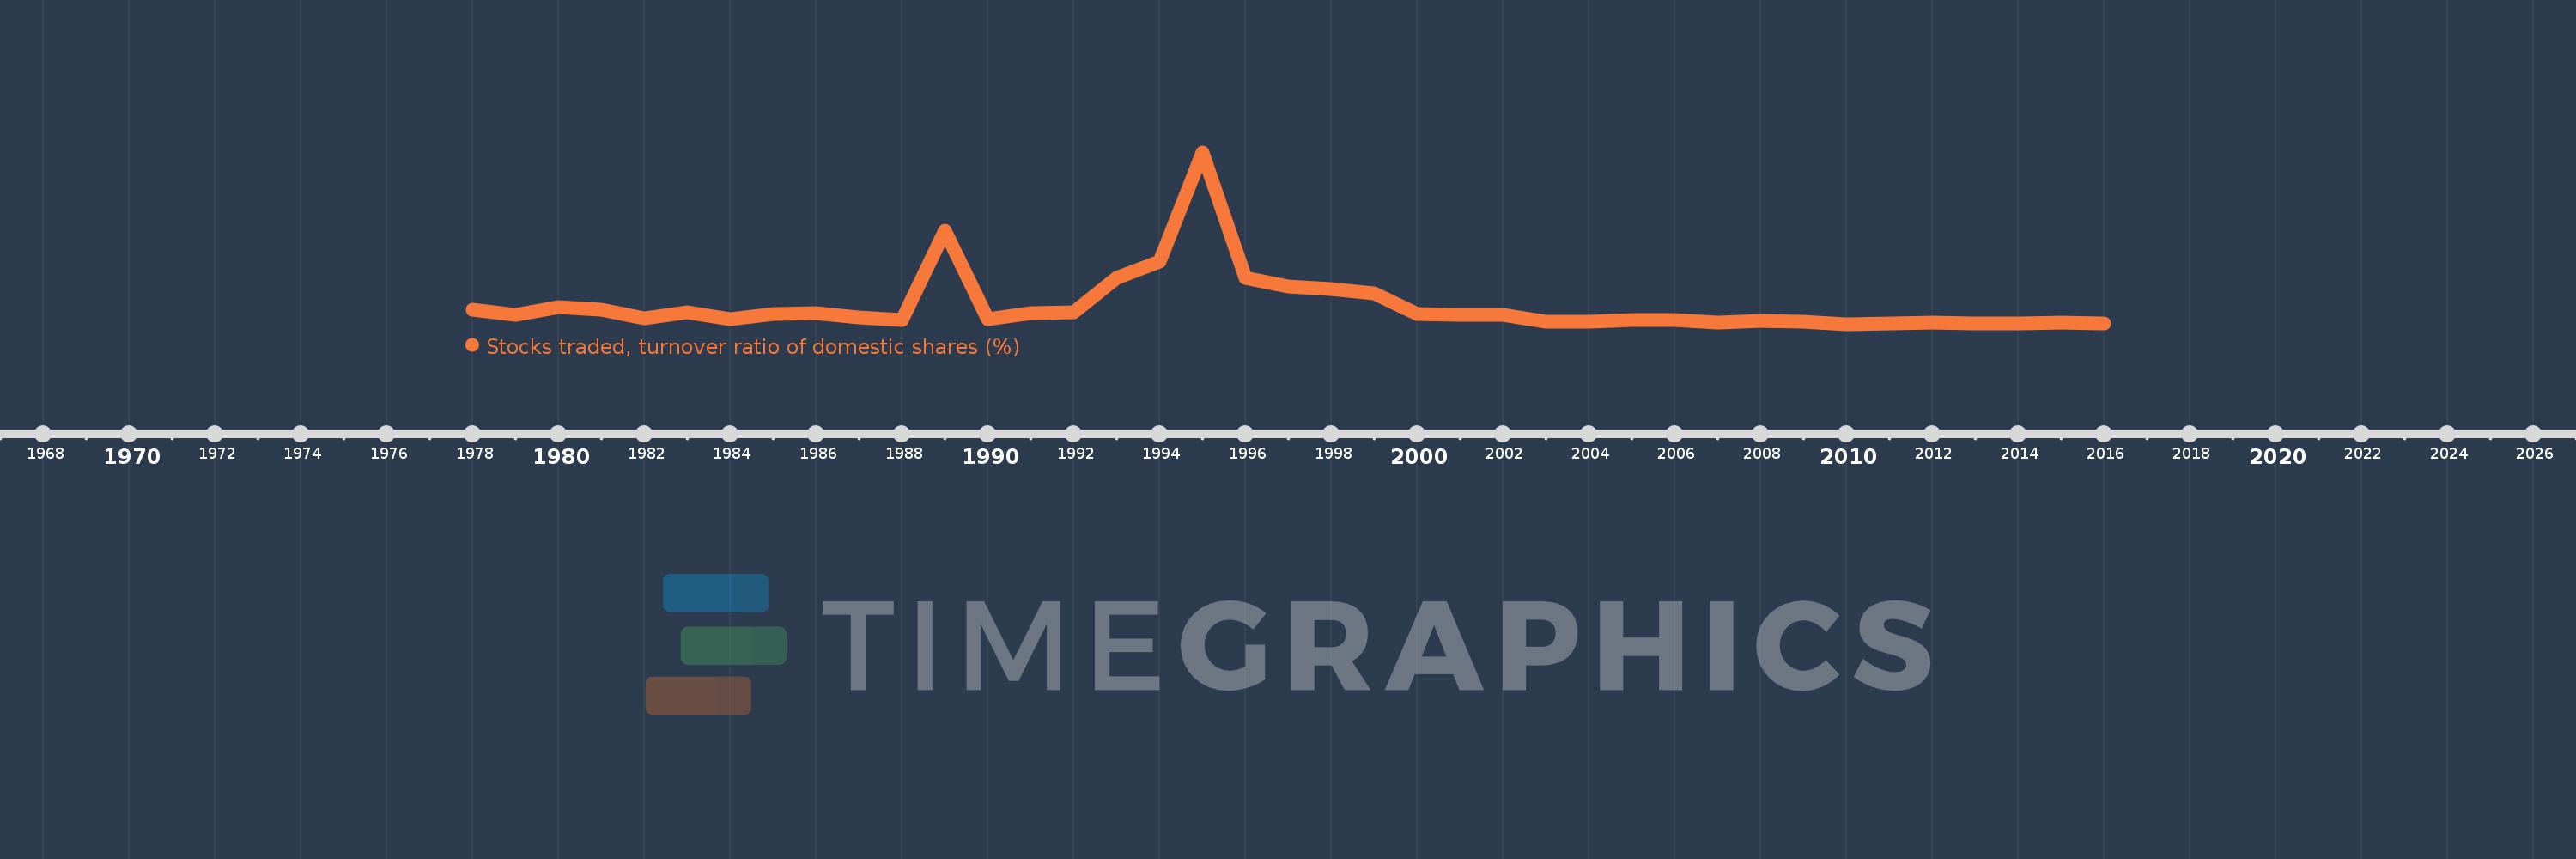
Stocks traded, turnover ratio of domestic shares (%)
2016,2015,2014,2013,2012,2011,2010,2009,2008,2007,2006,2005,2004,2003,2002,2001,2000,1999,1998,1997,1996,1995,1994,1993,1992,1991,1990,1989,1988,1987,1986,1985,1984,1983,1982,1981,1980,1979,1978
Estas estatísticas em outros países:
Linha do tempo:
Nesta escala de tempo está apresentado um gráfico de 1978 ano até 2016 ano Argentina. Dados de 1977 ano ausente. O número de observações reais por data: 39.
Fonte (nome):
Indicadores de desenvolvimento mundial
Fonte (organização):
World Federation of Exchanges database.
Categorias:
Financial Sector
Foi atualizado:
23 abr 2017 ano
Indicadores de alterações dos valores ao longo dos anos
Mínimo:
3.302
1 jan 2010 ano
Máximo:
306.039
1 jan 1995 ano
Na data de observação
Valor
Mudança absoluta
A alteração em relação ao valor anterior
1 jan 1978 ano
28.709
+28.709
0.0%
1 jan 1979 ano
19.606
-9.103
-31.71%
1 jan 1980 ano
34.064
+14.458
73.74%
1 jan 1981 ano
28.193
-5.871
-17.23%
1 jan 1982 ano
13.182
-15.011
-53.24%
1 jan 1983 ano
24.967
+11.785
89.4%
1 jan 1984 ano
12.674
-12.292
-49.24%
1 jan 1985 ano
21.637
+8.963
70.72%
1 jan 1986 ano
23.303
+1.666
7.7%
1 jan 1987 ano
15.036
-8.267
-35.47%
1 jan 1988 ano
10.153
-4.884
-32.48%
1 jan 1989 ano
167.391
+157.238
1.55 mil%
1 jan 1990 ano
12.385
-155.006
-92.6%
1 jan 1991 ano
22.149
+9.764
78.83%
1 jan 1992 ano
24.403
+2.254
10.18%
1 jan 1993 ano
84.511
+60.108
246.31%
1 jan 1994 ano
112.959
+28.448
33.66%
1 jan 1995 ano
306.039
+193.08
170.93%
1 jan 1996 ano
84.437
-221.602
-72.41%
1 jan 1997 ano
70.042
-14.395
-17.05%
1 jan 1998 ano
64.482
-5.56
-7.94%
1 jan 1999 ano
57.496
-6.986
-10.83%
1 jan 2000 ano
21.24
-36.256
-63.06%
1 jan 2001 ano
19.951
-1.289
-6.07%
1 jan 2002 ano
19.956
+0.004
0.02%
1 jan 2003 ano
7.052
-12.904
-64.66%
1 jan 2004 ano
8.371
+1.319
18.71%
1 jan 2005 ano
11.212
+2.841
33.94%
1 jan 2006 ano
11.048
-0.164
-1.46%
1 jan 2007 ano
6.612
-4.436
-40.15%
1 jan 2008 ano
8.49
+1.878
28.4%
1 jan 2009 ano
8.375
-0.114
-1.35%
1 jan 2010 ano
3.302
-5.073
-60.57%
1 jan 2011 ano
3.982
+0.68
20.58%
1 jan 2012 ano
5.632
+1.65
41.44%
1 jan 2013 ano
4.268
-1.363
-24.21%
1 jan 2014 ano
4.213
-0.055
-1.3%
1 jan 2015 ano
5.857
+1.644
39.02%
1 jan 2016 ano
4.81
-1.047
-17.88%
Classificação de países por estatísticas atuais por anos


Comentários: