29
/pt/
pt
AIzaSyAYiBZKx7MnpbEhh9jyipgxe19OcubqV5w
April 1, 2024
65150
Albania
ALB
true
2
1
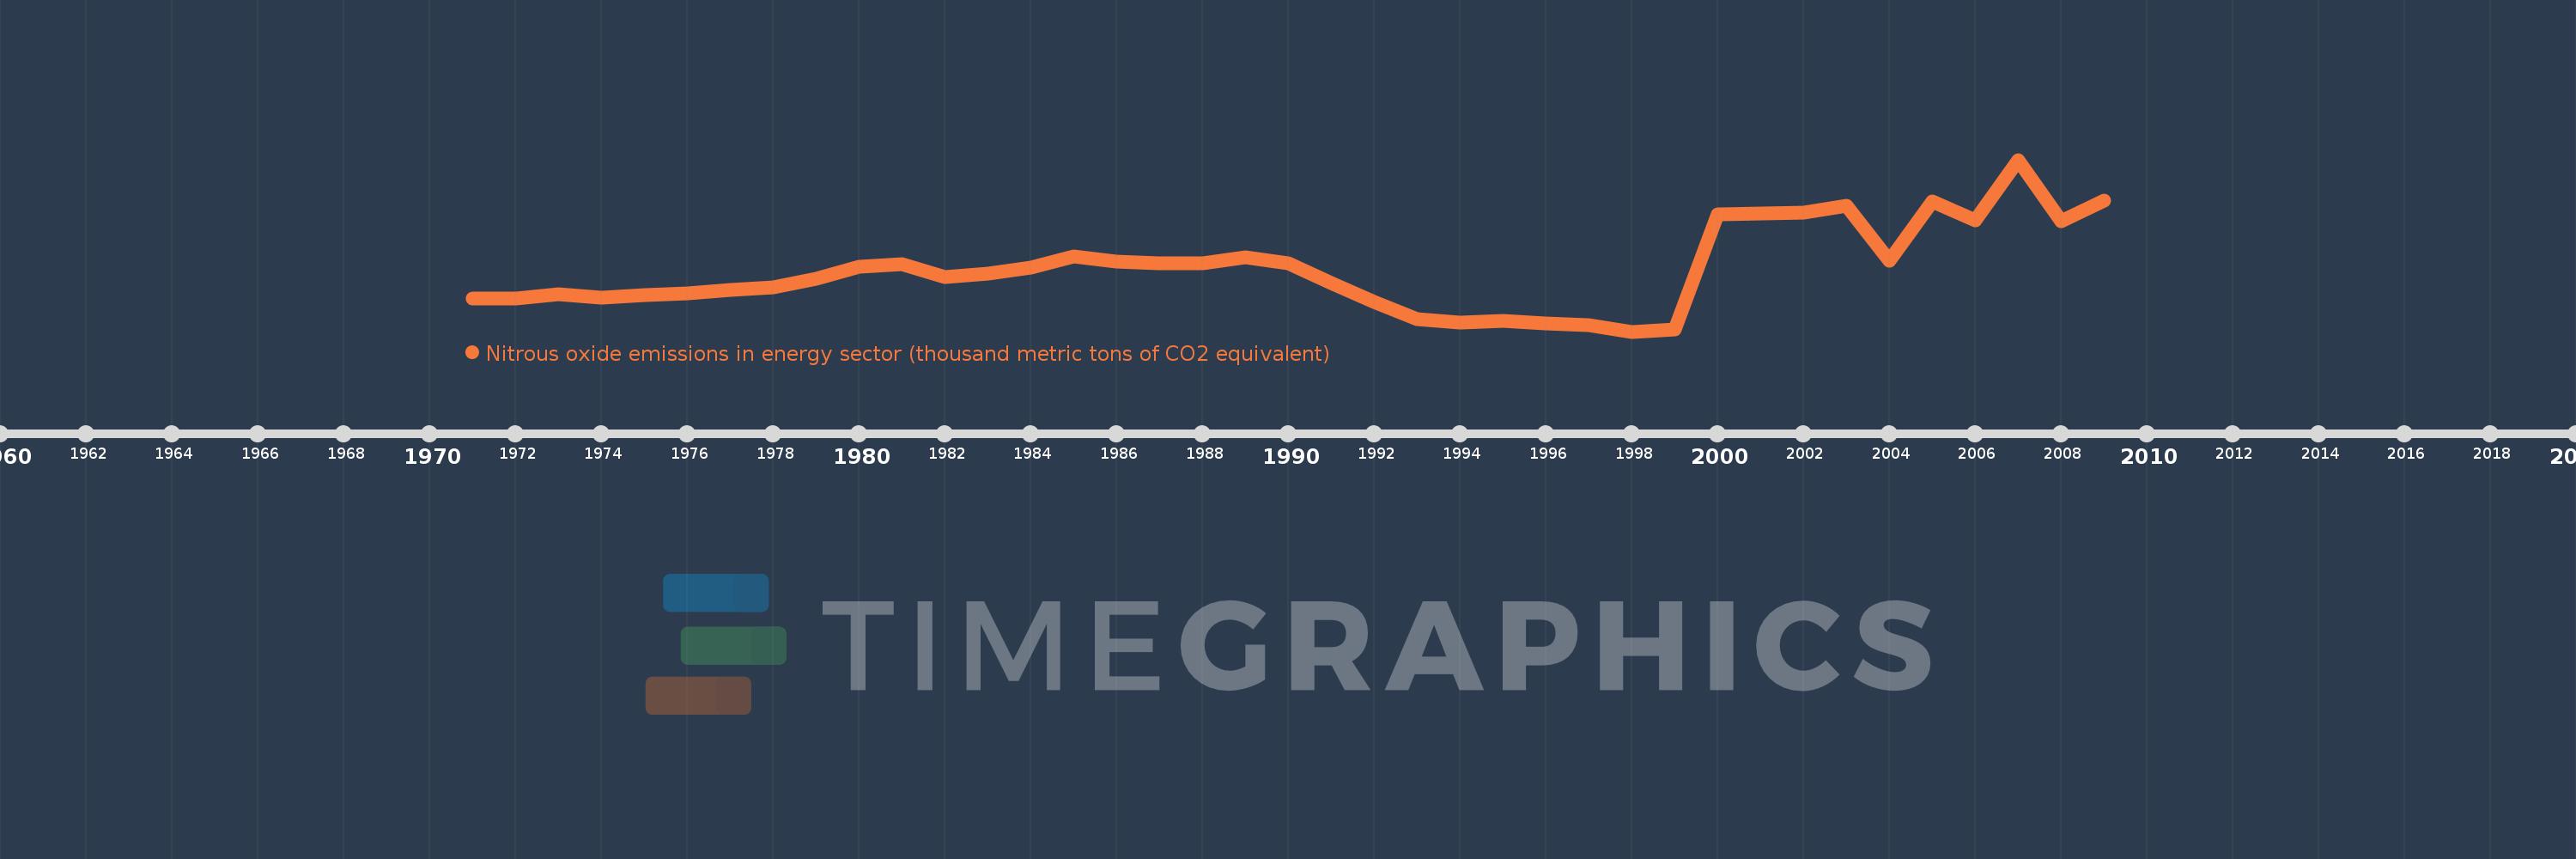
Nitrous oxide emissions in energy sector (thousand metric tons of CO2 equivalent)
2009,2008,2007,2006,2005,2004,2003,2002,2001,2000,1999,1998,1997,1996,1995,1994,1993,1992,1991,1990,1989,1988,1987,1986,1985,1984,1983,1982,1981,1980,1979,1978,1977,1976,1975,1974,1973,1972,1971
Estas estatísticas em outros países:
AfghanistanAlbaniaAlgeriaAmerican SamoaAndorraAngolaAntigua and BarbudaArab WorldArgentinaArmeniaArubaAustraliaAustriaAzerbaijanBahamas, TheBahrainBangladeshBarbadosBelarusBelgiumBelizeBeninBermudaBhutanBoliviaBosnia and HerzegovinaBotswanaBrazilBritish Virgin IslandsBrunei DarussalamBulgariaBurkina FasoBurundiCabo VerdeCambodiaCameroonCanadaCaribbean small statesCayman IslandsCentral African RepublicCentral Europe and the BalticsChadChannel IslandsChileChinaColombiaComorosCongo, Dem. Rep.Congo, Rep.Costa RicaCote d'IvoireCroatiaCubaCuracaoCyprusCzech RepublicDenmarkDjiboutiDominicaDominican RepublicEarly-demographic dividendEast Asia & PacificEast Asia & Pacific (excluding high income)East Asia & Pacific (IDA & IBRD countries)EcuadorEgypt, Arab Rep.El SalvadorEquatorial GuineaEritreaEstoniaEthiopiaEuro areaEurope & Central AsiaEurope & Central Asia (excluding high income)Europe & Central Asia (IDA & IBRD countries)European UnionFaroe IslandsFijiFinlandFragile and conflict affected situationsFranceFrench PolynesiaGabonGambia, TheGeorgiaGermanyGhanaGibraltarGreeceGreenlandGrenadaGuamGuatemalaGuineaGuinea-BissauGuyanaHaitiHeavily indebted poor countries (HIPC)High incomeHondurasHong Kong SAR, ChinaHungaryIBRD onlyIcelandIDA & IBRD totalIDA blendIDA onlyIDA totalIndiaIndonesiaIran, Islamic Rep.IraqIrelandIsle of ManIsraelItalyJamaicaJapanJordanKazakhstanKenyaKiribatiKorea, Dem. People’s Rep.Korea, Rep.KosovoKuwaitKyrgyz RepublicLao PDRLate-demographic dividendLatin America & Caribbean Latin America & Caribbean (excluding high income)Latin America & the Caribbean (IDA & IBRD countries)LatviaLeast developed countries: UN classificationLebanonLesothoLiberiaLibyaLiechtensteinLithuaniaLow & middle incomeLow incomeLower middle incomeLuxembourgMacao SAR, ChinaMacedonia, FYRMadagascarMalawiMalaysiaMaldivesMaliMaltaMarshall IslandsMauritaniaMauritiusMexicoMicronesia, Fed. Sts.Middle East & North AfricaMiddle East & North Africa (excluding high income)Middle East & North Africa (IDA & IBRD countries)Middle incomeMoldovaMonacoMongoliaMontenegroMoroccoMozambiqueMyanmarNamibiaNauruNepalNetherlandsNew CaledoniaNew ZealandNicaraguaNigerNigeriaNorth AmericaNorthern Mariana IslandsNorwayOECD membersOmanOther small statesPacific island small statesPakistanPalauPanamaPapua New GuineaParaguayPeruPhilippinesPolandPortugalPost-demographic dividendPre-demographic dividendPuerto RicoQatarRomaniaRussian FederationRwandaSamoaSan MarinoSao Tome and PrincipeSaudi ArabiaSenegalSerbiaSeychellesSierra LeoneSingaporeSint Maarten (Dutch part)Slovak RepublicSloveniaSmall statesSolomon IslandsSomaliaSouth AfricaSouth AsiaSouth Asia (IDA & IBRD)South SudanSpainSri LankaSt. Kitts and NevisSt. LuciaSt. Martin (French part)St. Vincent and the GrenadinesSub-Saharan Africa Sub-Saharan Africa (excluding high income)Sub-Saharan Africa (IDA & IBRD countries)SudanSurinameSwazilandSwedenSwitzerlandSyrian Arab RepublicTajikistanTanzaniaThailandTimor-LesteTogoTongaTrinidad and TobagoTunisiaTurkeyTurkmenistanTurks and Caicos IslandsTuvaluUgandaUkraineUnited Arab EmiratesUnited KingdomUnited StatesUpper middle incomeUruguayUzbekistanVanuatuVenezuela, RBVietnamVirgin Islands (U.S.)West Bank and GazaWorldYemen, Rep.ZambiaZimbabwe Linha do tempo:
Nesta escala de tempo está apresentado um gráfico de 1971 ano até 2009 ano Albania. Dados de 1970 ano ausente. O número de observações reais por data: 39.
Fonte (nome):
Indicadores de desenvolvimento mundial
Fonte (organização):
European Commission, Joint Research Centre (JRC)/Netherlands Environmental Assessment Agency (PBL). Emission Database for Global Atmospheric Research (EDGAR): http://edgar.jrc.ec.europa.eu/
Categorias:
Energy & Mining, Environment
Foi atualizado:
23 abr 2017 ano
Indicadores de alterações dos valores ao longo dos anos
Mínimo:
21.527
1 jan 1998 ano
Máximo:
82.727
1 jan 2007 ano
Na data de observação
Valor
Mudança absoluta
A alteração em relação ao valor anterior
1 jan 1971 ano
33.238
+33.238
0.0%
1 jan 1972 ano
33.237
-0.001
0.0%
1 jan 1973 ano
34.973
+1.736
5.22%
1 jan 1974 ano
33.617
-1.355
-3.88%
1 jan 1975 ano
34.473
+0.856
2.55%
1 jan 1976 ano
34.998
+0.525
1.52%
1 jan 1977 ano
36.455
+1.457
4.16%
1 jan 1978 ano
37.401
+0.946
2.59%
1 jan 1979 ano
40.42
+3.019
8.07%
1 jan 1980 ano
44.75
+4.331
10.71%
1 jan 1981 ano
45.456
+0.705
1.58%
1 jan 1982 ano
40.919
-4.537
-9.98%
1 jan 1983 ano
42.058
+1.139
2.78%
1 jan 1984 ano
44.313
+2.255
5.36%
1 jan 1985 ano
48.319
+4.006
9.04%
1 jan 1986 ano
46.393
-1.925
-3.98%
1 jan 1987 ano
45.917
-0.477
-1.03%
1 jan 1988 ano
45.978
+0.061
0.13%
1 jan 1989 ano
47.912
+1.934
4.21%
1 jan 1990 ano
45.822
-2.09
-4.36%
1 jan 1991 ano
38.901
-6.92
-15.1%
1 jan 1992 ano
31.983
-6.918
-17.78%
1 jan 1993 ano
25.874
-6.109
-19.1%
1 jan 1994 ano
24.699
-1.176
-4.54%
1 jan 1995 ano
25.402
+0.704
2.85%
1 jan 1996 ano
24.372
-1.03
-4.05%
1 jan 1997 ano
23.929
-0.443
-1.82%
1 jan 1998 ano
21.527
-2.402
-10.04%
1 jan 1999 ano
22.404
+0.877
4.07%
1 jan 2000 ano
63.352
+40.948
182.77%
1 jan 2001 ano
63.656
+0.303
0.48%
1 jan 2002 ano
63.988
+0.333
0.52%
1 jan 2003 ano
66.377
+2.388
3.73%
1 jan 2004 ano
46.794
-19.583
-29.5%
1 jan 2005 ano
67.803
+21.009
44.9%
1 jan 2006 ano
61.188
-6.615
-9.76%
1 jan 2007 ano
82.727
+21.539
35.2%
1 jan 2008 ano
60.849
-21.879
-26.45%
1 jan 2009 ano
68.258
+7.41
12.18%
Classificação de países por estatísticas atuais por anos


Comentários: