29
/pt/
pt
AIzaSyAYiBZKx7MnpbEhh9jyipgxe19OcubqV5w
April 1, 2024
62334
World
WLD
false
2
1
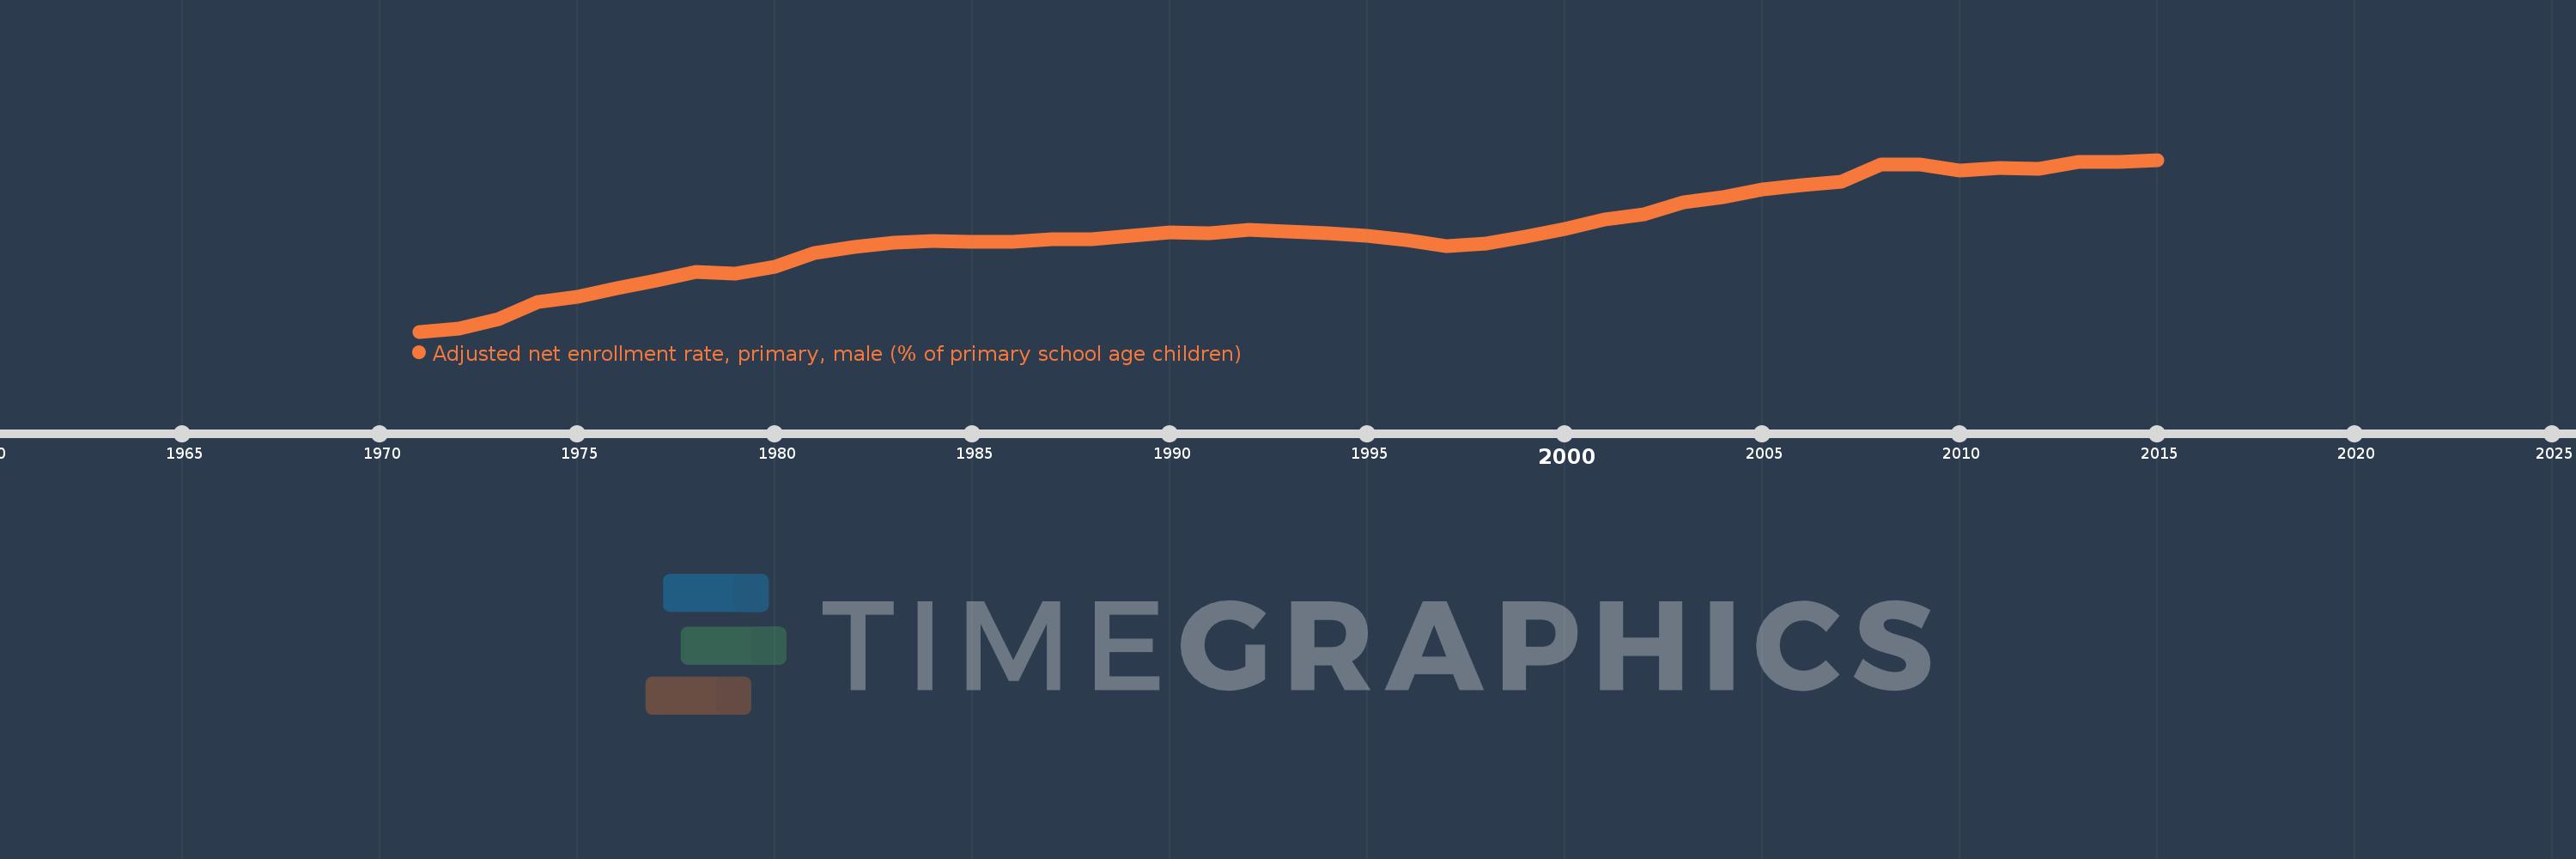
Adjusted net enrollment rate, primary, male (% of primary school age children)
2015,2014,2013,2012,2011,2010,2009,2008,2007,2006,2005,2004,2003,2002,2001,2000,1999,1998,1997,1996,1995,1994,1993,1992,1991,1990,1989,1988,1987,1986,1985,1984,1983,1982,1981,1980,1979,1978,1977,1976,1975,1974,1973,1972,1971
Estas estatísticas em outros países:
AfghanistanAlbaniaAlgeriaAngolaAntigua and BarbudaArab WorldArgentinaArmeniaArubaAustraliaAustriaAzerbaijanBahamas, TheBahrainBangladeshBarbadosBelarusBelgiumBelizeBeninBermudaBhutanBoliviaBosnia and HerzegovinaBotswanaBrazilBrunei DarussalamBulgariaBurkina FasoBurundiCabo VerdeCambodiaCameroonCanadaCaribbean small statesCentral African RepublicCentral Europe and the BalticsChadChileChinaColombiaComorosCongo, Dem. Rep.Congo, Rep.Costa RicaCote d'IvoireCroatiaCubaCyprusDenmarkDjiboutiDominicaDominican RepublicEarly-demographic dividendEast Asia & PacificEast Asia & Pacific (excluding high income)East Asia & Pacific (IDA & IBRD countries)EcuadorEgypt, Arab Rep.El SalvadorEquatorial GuineaEritreaEstoniaEthiopiaEuro areaEurope & Central AsiaEurope & Central Asia (excluding high income)Europe & Central Asia (IDA & IBRD countries)European UnionFijiFinlandFragile and conflict affected situationsFranceGabonGambia, TheGeorgiaGhanaGreeceGrenadaGuatemalaGuineaGuinea-BissauGuyanaHaitiHeavily indebted poor countries (HIPC)High incomeHondurasHong Kong SAR, ChinaHungaryIBRD onlyIcelandIDA & IBRD totalIDA blendIDA onlyIDA totalIndiaIndonesiaIran, Islamic Rep.IraqIrelandIsraelItalyJamaicaJapanJordanKazakhstanKenyaKiribatiKorea, Dem. People’s Rep.Korea, Rep.KuwaitKyrgyz RepublicLao PDRLate-demographic dividendLatin America & Caribbean Latin America & Caribbean (excluding high income)Latin America & the Caribbean (IDA & IBRD countries)LatviaLeast developed countries: UN classificationLebanonLesothoLiberiaLibyaLiechtensteinLithuaniaLow & middle incomeLow incomeLower middle incomeLuxembourgMacao SAR, ChinaMacedonia, FYRMadagascarMalawiMaldivesMaliMaltaMarshall IslandsMauritaniaMauritiusMexicoMicronesia, Fed. Sts.Middle East & North AfricaMiddle East & North Africa (excluding high income)Middle East & North Africa (IDA & IBRD countries)Middle incomeMoldovaMongoliaMontenegroMoroccoMozambiqueMyanmarNamibiaNauruNepalNetherlandsNew ZealandNicaraguaNigerNigeriaNorth AmericaNorwayOECD membersOmanOther small statesPacific island small statesPakistanPanamaPapua New GuineaParaguayPeruPhilippinesPolandPortugalPost-demographic dividendPre-demographic dividendPuerto RicoQatarRomaniaRussian FederationRwandaSamoaSan MarinoSao Tome and PrincipeSaudi ArabiaSenegalSerbiaSeychellesSierra LeoneSloveniaSmall statesSolomon IslandsSomaliaSouth AfricaSouth AsiaSouth Asia (IDA & IBRD)South SudanSpainSri LankaSt. Kitts and NevisSt. LuciaSt. Vincent and the GrenadinesSub-Saharan Africa Sub-Saharan Africa (excluding high income)Sub-Saharan Africa (IDA & IBRD countries)SudanSurinameSwazilandSwedenSwitzerlandSyrian Arab RepublicTajikistanTanzaniaThailandTimor-LesteTogoTongaTrinidad and TobagoTunisiaTurkeyTuvaluUgandaUkraineUnited Arab EmiratesUnited KingdomUnited StatesUpper middle incomeUruguayUzbekistanVanuatuVenezuela, RBWest Bank and GazaWorldYemen, Rep.ZambiaZimbabwe Linha do tempo:
Nesta escala de tempo está apresentado um gráfico de 1971 ano até 2015 ano World. Dados de 1970 ano ausente. O número de observações reais por data: 45.
Fonte (nome):
Indicadores de desenvolvimento mundial
Fonte (organização):
United Nations Educational, Scientific, and Cultural Organization (UNESCO) Institute for Statistics.
Categorias:
Education, Gender
Foi atualizado:
23 abr 2017 ano
Indicadores de alterações dos valores ao longo dos anos
Mínimo:
79.748
1 jan 1971 ano
Máximo:
91.872
1 jan 2015 ano
Na data de observação
Valor
Mudança absoluta
A alteração em relação ao valor anterior
1 jan 1971 ano
79.748
+79.748
0.0%
1 jan 1972 ano
79.961
+0.213
0.27%
1 jan 1973 ano
80.604
+0.643
0.8%
1 jan 1974 ano
81.837
+1.233
1.53%
1 jan 1975 ano
82.183
+0.346
0.42%
1 jan 1976 ano
82.793
+0.61
0.74%
1 jan 1977 ano
83.376
+0.583
0.7%
1 jan 1978 ano
83.954
+0.578
0.69%
1 jan 1979 ano
83.817
-0.137
-0.16%
1 jan 1980 ano
84.322
+0.504
0.6%
1 jan 1981 ano
85.277
+0.956
1.13%
1 jan 1982 ano
85.725
+0.448
0.53%
1 jan 1983 ano
86.023
+0.298
0.35%
1 jan 1984 ano
86.115
+0.092
0.11%
1 jan 1985 ano
86.066
-0.049
-0.06%
1 jan 1986 ano
86.08
+0.014
0.02%
1 jan 1987 ano
86.24
+0.16
0.19%
1 jan 1988 ano
86.244
+0.004
0.0%
1 jan 1989 ano
86.504
+0.259
0.3%
1 jan 1990 ano
86.751
+0.248
0.29%
1 jan 1991 ano
86.713
-0.038
-0.04%
1 jan 1992 ano
86.918
+0.205
0.24%
1 jan 1993 ano
86.83
-0.088
-0.1%
1 jan 1994 ano
86.681
-0.149
-0.17%
1 jan 1995 ano
86.53
-0.151
-0.17%
1 jan 1996 ano
86.189
-0.341
-0.39%
1 jan 1997 ano
85.795
-0.394
-0.46%
1 jan 1998 ano
85.956
+0.161
0.19%
1 jan 1999 ano
86.461
+0.506
0.59%
1 jan 2000 ano
86.974
+0.512
0.59%
1 jan 2001 ano
87.677
+0.703
0.81%
1 jan 2002 ano
88.001
+0.324
0.37%
1 jan 2003 ano
88.88
+0.879
1.0%
1 jan 2004 ano
89.214
+0.334
0.38%
1 jan 2005 ano
89.783
+0.57
0.64%
1 jan 2006 ano
90.09
+0.307
0.34%
1 jan 2007 ano
90.348
+0.258
0.29%
1 jan 2008 ano
91.534
+1.186
1.31%
1 jan 2009 ano
91.52
-0.014
-0.02%
1 jan 2010 ano
91.095
-0.426
-0.46%
1 jan 2011 ano
91.301
+0.206
0.23%
1 jan 2012 ano
91.265
-0.036
-0.04%
1 jan 2013 ano
91.693
+0.428
0.47%
1 jan 2014 ano
91.729
+0.036
0.04%
1 jan 2015 ano
91.872
+0.143
0.16%
Classificação de países por estatísticas atuais por anos


Comentários: