29
/pt/
pt
AIzaSyAYiBZKx7MnpbEhh9jyipgxe19OcubqV5w
April 1, 2024
60470
Sub-Saharan Africa (excluding high income)
SSA
false
2
1
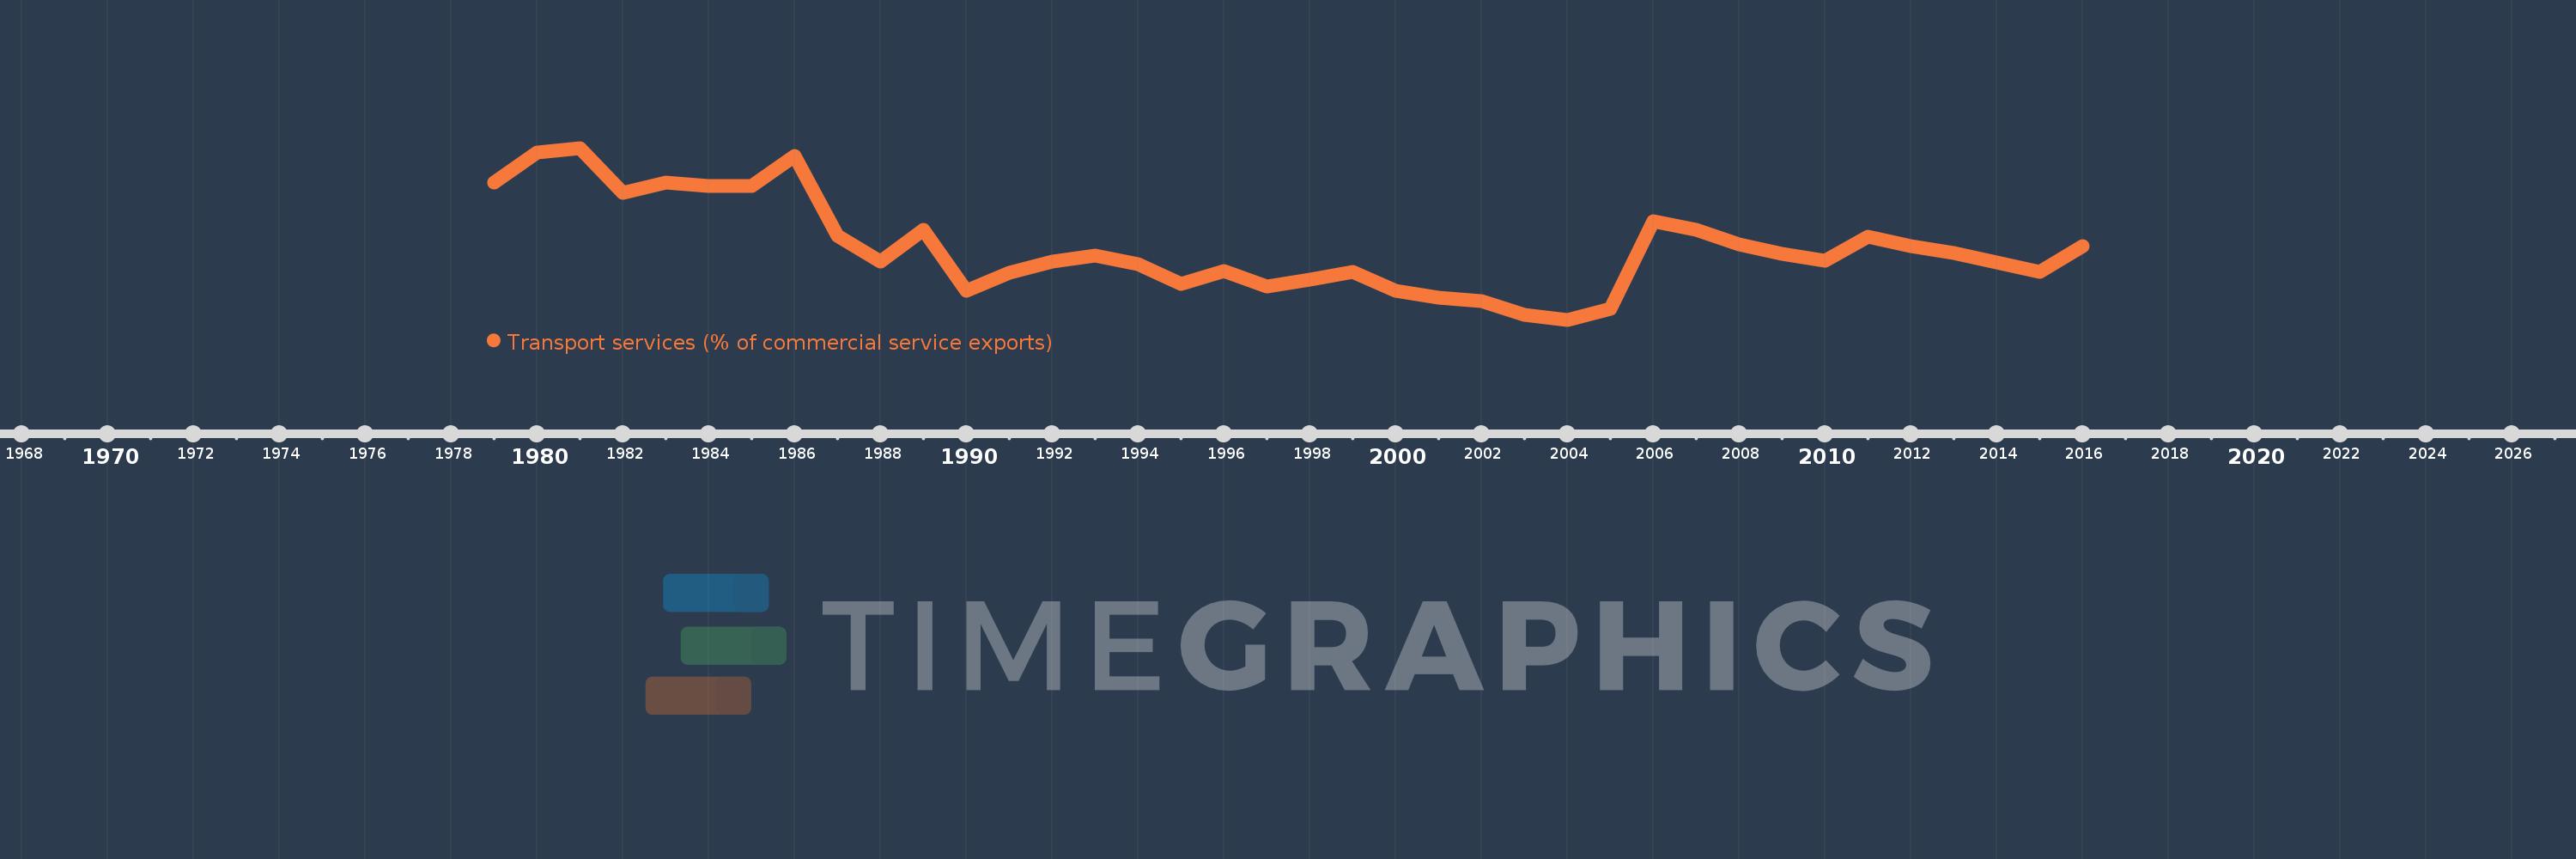
Transport services (% of commercial service exports)
2016,2015,2014,2013,2012,2011,2010,2009,2008,2007,2006,2005,2004,2003,2002,2001,2000,1999,1998,1997,1996,1995,1994,1993,1992,1991,1990,1989,1988,1987,1986,1985,1984,1983,1982,1981,1980,1979
Estas estatísticas em outros países:
AfghanistanAlbaniaAlgeriaAngolaAntigua and BarbudaArab WorldArgentinaArmeniaArubaAustraliaAustriaAzerbaijanBahamas, TheBahrainBangladeshBarbadosBelarusBelgiumBelizeBeninBermudaBhutanBoliviaBosnia and HerzegovinaBotswanaBrazilBrunei DarussalamBulgariaBurkina FasoBurundiCabo VerdeCambodiaCameroonCanadaCaribbean small statesCentral African RepublicCentral Europe and the BalticsChadChileChinaColombiaComorosCongo, Dem. Rep.Congo, Rep.Costa RicaCote d'IvoireCroatiaCuracaoCyprusCzech RepublicDenmarkDjiboutiDominicaDominican RepublicEarly-demographic dividendEast Asia & PacificEast Asia & Pacific (excluding high income)East Asia & Pacific (IDA & IBRD countries)EcuadorEgypt, Arab Rep.El SalvadorEritreaEstoniaEthiopiaEuro areaEurope & Central AsiaEurope & Central Asia (excluding high income)Europe & Central Asia (IDA & IBRD countries)European UnionFaroe IslandsFijiFinlandFragile and conflict affected situationsFranceFrench PolynesiaGabonGambia, TheGeorgiaGermanyGhanaGreeceGrenadaGuatemalaGuineaGuinea-BissauGuyanaHaitiHeavily indebted poor countries (HIPC)High incomeHondurasHong Kong SAR, ChinaHungaryIBRD onlyIcelandIDA & IBRD totalIDA onlyIDA totalIndiaIndonesiaIran, Islamic Rep.IraqIrelandIsraelItalyJamaicaJapanJordanKazakhstanKenyaKiribatiKorea, Rep.KosovoKuwaitKyrgyz RepublicLao PDRLate-demographic dividendLatin America & Caribbean Latin America & Caribbean (excluding high income)Latin America & the Caribbean (IDA & IBRD countries)LatviaLeast developed countries: UN classificationLebanonLesothoLiberiaLibyaLithuaniaLow & middle incomeLow incomeLower middle incomeLuxembourgMacao SAR, ChinaMacedonia, FYRMadagascarMalawiMalaysiaMaldivesMaliMaltaMarshall IslandsMauritaniaMauritiusMexicoMicronesia, Fed. Sts.Middle East & North AfricaMiddle East & North Africa (excluding high income)Middle East & North Africa (IDA & IBRD countries)Middle incomeMoldovaMongoliaMontenegroMoroccoMozambiqueMyanmarNamibiaNepalNetherlandsNew CaledoniaNew ZealandNicaraguaNigerNigeriaNorth AmericaNorwayOECD membersOmanOther small statesPacific island small statesPakistanPalauPanamaPapua New GuineaParaguayPeruPhilippinesPolandPortugalPost-demographic dividendPre-demographic dividendQatarRomaniaRussian FederationRwandaSamoaSao Tome and PrincipeSaudi ArabiaSenegalSerbiaSeychellesSierra LeoneSingaporeSint Maarten (Dutch part)Slovak RepublicSloveniaSmall statesSolomon IslandsSouth AfricaSouth AsiaSouth Asia (IDA & IBRD)South SudanSpainSri LankaSt. Kitts and NevisSt. LuciaSt. Vincent and the GrenadinesSub-Saharan Africa Sub-Saharan Africa (excluding high income)Sub-Saharan Africa (IDA & IBRD countries)SudanSurinameSwazilandSwedenSwitzerlandSyrian Arab RepublicTajikistanTanzaniaThailandTimor-LesteTogoTongaTrinidad and TobagoTunisiaTurkeyTuvaluUgandaUkraineUnited KingdomUnited StatesUpper middle incomeUruguayVanuatuVenezuela, RBWest Bank and GazaWorldYemen, Rep.ZambiaZimbabwe Linha do tempo:
Nesta escala de tempo está apresentado um gráfico de 1979 ano até 2016 ano Sub-Saharan Africa (excluding high income). Dados de 1978 ano ausente. O número de observações reais por data: 38.
Fonte (nome):
Indicadores de desenvolvimento mundial
Fonte (organização):
International Monetary Fund, Balance of Payments Statistics Yearbook and data files.
Categorias:
Private Sector, Trade
Foi atualizado:
23 abr 2017 ano
Indicadores de alterações dos valores ao longo dos anos
Mínimo:
16.777
1 jan 2004 ano
Máximo:
49.113
1 jan 1981 ano
Na data de observação
Valor
Mudança absoluta
A alteração em relação ao valor anterior
1 jan 1979 ano
42.643
+42.643
0.0%
1 jan 1980 ano
48.252
+5.609
13.15%
1 jan 1981 ano
49.113
+0.861
1.78%
1 jan 1982 ano
40.586
-8.526
-17.36%
1 jan 1983 ano
42.634
+2.047
5.04%
1 jan 1984 ano
42.024
-0.61
-1.43%
1 jan 1985 ano
41.89
-0.134
-0.32%
1 jan 1986 ano
47.646
+5.756
13.74%
1 jan 1987 ano
32.56
-15.086
-31.66%
1 jan 1988 ano
27.663
-4.897
-15.04%
1 jan 1989 ano
33.767
+6.104
22.07%
1 jan 1990 ano
22.266
-11.501
-34.06%
1 jan 1991 ano
25.699
+3.433
15.42%
1 jan 1992 ano
27.696
+1.998
7.77%
1 jan 1993 ano
28.933
+1.237
4.47%
1 jan 1994 ano
27.255
-1.678
-5.8%
1 jan 1995 ano
23.563
-3.692
-13.55%
1 jan 1996 ano
25.931
+2.369
10.05%
1 jan 1997 ano
22.996
-2.936
-11.32%
1 jan 1998 ano
24.336
+1.34
5.83%
1 jan 1999 ano
25.729
+1.394
5.73%
1 jan 2000 ano
22.199
-3.531
-13.72%
1 jan 2001 ano
20.869
-1.329
-5.99%
1 jan 2002 ano
20.219
-0.651
-3.12%
1 jan 2003 ano
17.668
-2.55
-12.61%
1 jan 2004 ano
16.777
-0.892
-5.05%
1 jan 2005 ano
18.885
+2.109
12.57%
1 jan 2006 ano
35.398
+16.513
87.44%
1 jan 2007 ano
33.726
-1.673
-4.72%
1 jan 2008 ano
30.964
-2.762
-8.19%
1 jan 2009 ano
29.101
-1.862
-6.02%
1 jan 2010 ano
27.908
-1.193
-4.1%
1 jan 2011 ano
32.406
+4.498
16.12%
1 jan 2012 ano
30.585
-1.821
-5.62%
1 jan 2013 ano
29.364
-1.221
-3.99%
1 jan 2014 ano
27.533
-1.831
-6.24%
1 jan 2015 ano
25.743
-1.79
-6.5%
1 jan 2016 ano
30.627
+4.885
18.98%
Classificação de países por estatísticas atuais por anos


Comentários: