30
/pt/
AIzaSyAYiBZKx7MnpbEhh9jyipgxe19OcubqV5w
April 1, 2024
58632
South Asia (IDA & IBRD)
TSA
false
2
1
Unemployment with tertiary education, male (% of male unemployment)
2011,2006,2005,2004,2003,2002,2001,2000,1999,1998,1997,1996,1995,1994,1993,1992
Download
Biblioteca de estatísticas globais →South Asia (IDA & IBRD) →

Unemployment with tertiary education, male (% of male unemployment)

Estas estatísticas em outros países:

AlbaniaAlgeriaArgentinaArmeniaArubaAustraliaAustriaAzerbaijanBahamas, TheBahrainBangladeshBarbadosBelarusBelgiumBelizeBermudaBhutanBoliviaBosnia and HerzegovinaBotswanaBrazilBritish Virgin IslandsBrunei DarussalamBulgariaBurkina FasoCanadaCaribbean small statesCayman IslandsCentral African RepublicCentral Europe and the BalticsChileColombiaCosta RicaCroatiaCubaCyprusCzech RepublicDenmarkDominicaDominican RepublicEarly-demographic dividendEcuadorEgypt, Arab Rep.El SalvadorEstoniaEthiopiaEuro areaEurope & Central AsiaEurope & Central Asia (excluding high income)Europe & Central Asia (IDA & IBRD countries)European UnionFijiFinlandFranceGabonGeorgiaGermanyGreeceGuatemalaHigh incomeHondurasHong Kong SAR, ChinaHungaryIcelandIndiaIndonesiaIran, Islamic Rep.IrelandIsraelItalyJamaicaJapanJordanKazakhstanKorea, Rep.KosovoKuwaitKyrgyz RepublicLatin America & Caribbean Latin America & Caribbean (excluding high income)Latin America & the Caribbean (IDA & IBRD countries)LatviaLebanonLesothoLithuaniaLower middle incomeLuxembourgMacao SAR, ChinaMacedonia, FYRMadagascarMalaysiaMaltaMauritiusMexicoMiddle East & North AfricaMiddle East & North Africa (excluding high income)Middle East & North Africa (IDA & IBRD countries)MoldovaMongoliaMontenegroMoroccoNamibiaNetherlandsNew CaledoniaNew ZealandNicaraguaNorth AmericaNorwayOECD membersOmanPakistanPanamaParaguayPeruPhilippinesPolandPortugalPost-demographic dividendQatarRomaniaRussian FederationRwandaSan MarinoSaudi ArabiaSenegalSerbiaSingaporeSlovak RepublicSloveniaSouth AfricaSouth AsiaSouth Asia (IDA & IBRD)SpainSri LankaSt. LuciaSt. Vincent and the GrenadinesSurinameSwedenSwitzerlandSyrian Arab RepublicTajikistanTanzaniaThailandTimor-LesteTongaTrinidad and TobagoTunisiaTurkeyUkraineUnited Arab EmiratesUnited KingdomUnited StatesUruguayVenezuela, RBWest Bank and GazaZimbabwe

Linha do tempo:

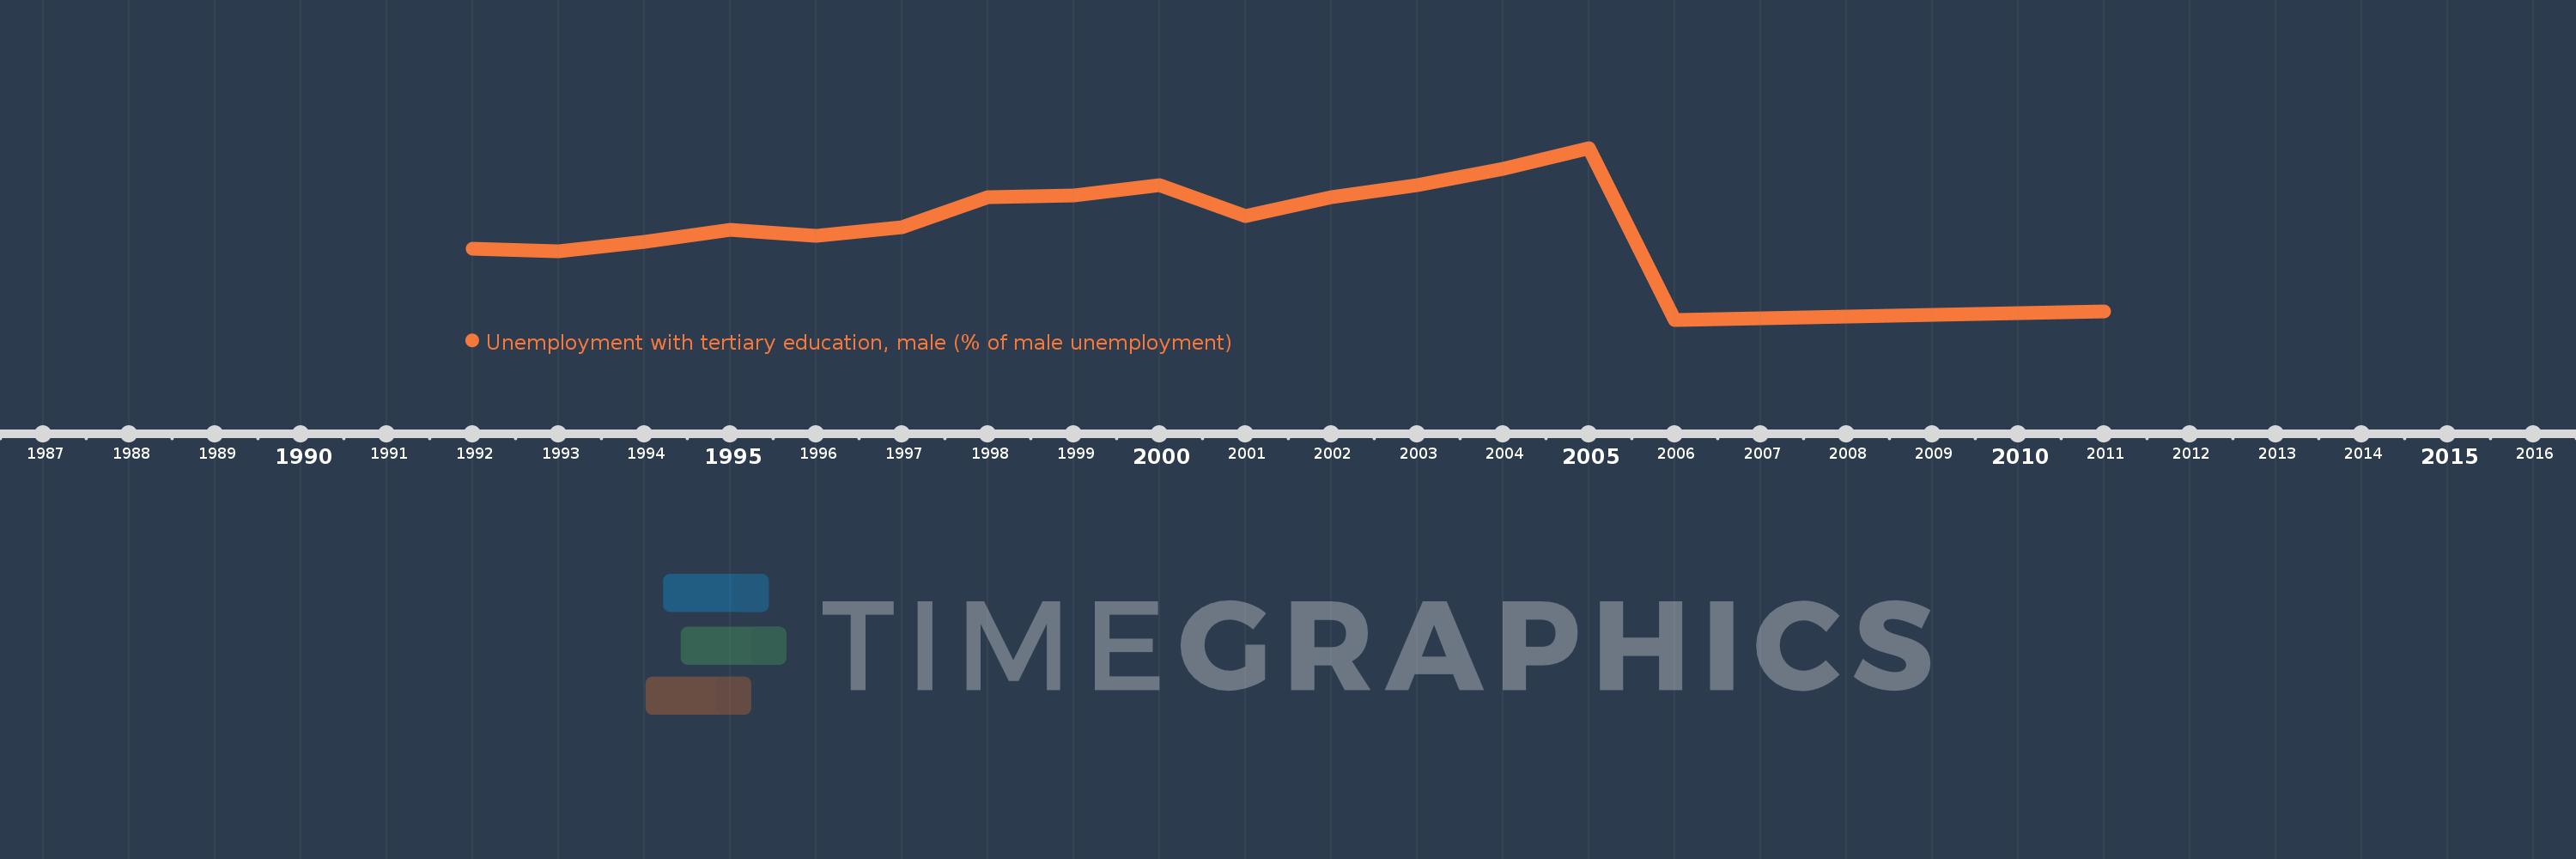
Nesta escala de tempo está apresentado um gráfico de 1992 ano até 2011 ano South Asia (IDA & IBRD). Dados de 1991 ano ausente. O número de observações reais por data: 16.

Fonte (nome):

Indicadores de desenvolvimento mundial

Fonte (organização):

International Labour Organization, Key Indicators of the Labour Market database.

Categorias:

Social Protection & Labor, Gender

Foi atualizado:

23 abr 2017 ano

Indicadores de alterações dos valores ao longo dos anos

Em média:
26.425
Mínimo:
19.658
1 jan 2006 ano
Máximo:
31.614
1 jan 2005 ano
Na data de observação
Valor
Mudança absoluta
A alteração em relação ao valor anterior
1 jan 1992 ano
24.6
+24.6
0.0%
1 jan 1993 ano
24.4
-0.2
-0.81%
1 jan 1994 ano
25.1
+0.7
2.87%
1 jan 1995 ano
25.9
+0.8
3.19%
1 jan 1996 ano
25.499
-0.401
-1.55%
1 jan 1997 ano
26.102
+0.603
2.37%
1 jan 1998 ano
28.2
+2.098
8.04%
1 jan 1999 ano
28.3
+0.1
0.35%
1 jan 2000 ano
29.0
+0.7
2.47%
1 jan 2001 ano
26.852
-2.148
-7.41%
1 jan 2002 ano
28.202
+1.35
5.03%
1 jan 2003 ano
29.007
+0.805
2.85%
1 jan 2004 ano
30.135
+1.129
3.89%
1 jan 2005 ano
31.614
+1.479
4.91%
1 jan 2006 ano
19.658
-11.956
-37.82%
1 jan 2011 ano
20.224
+0.566
2.88%

Classificação de países por estatísticas atuais por anos