29
/pt/
pt
AIzaSyAYiBZKx7MnpbEhh9jyipgxe19OcubqV5w
April 1, 2024
57380
South Asia
SAS
false
2
1
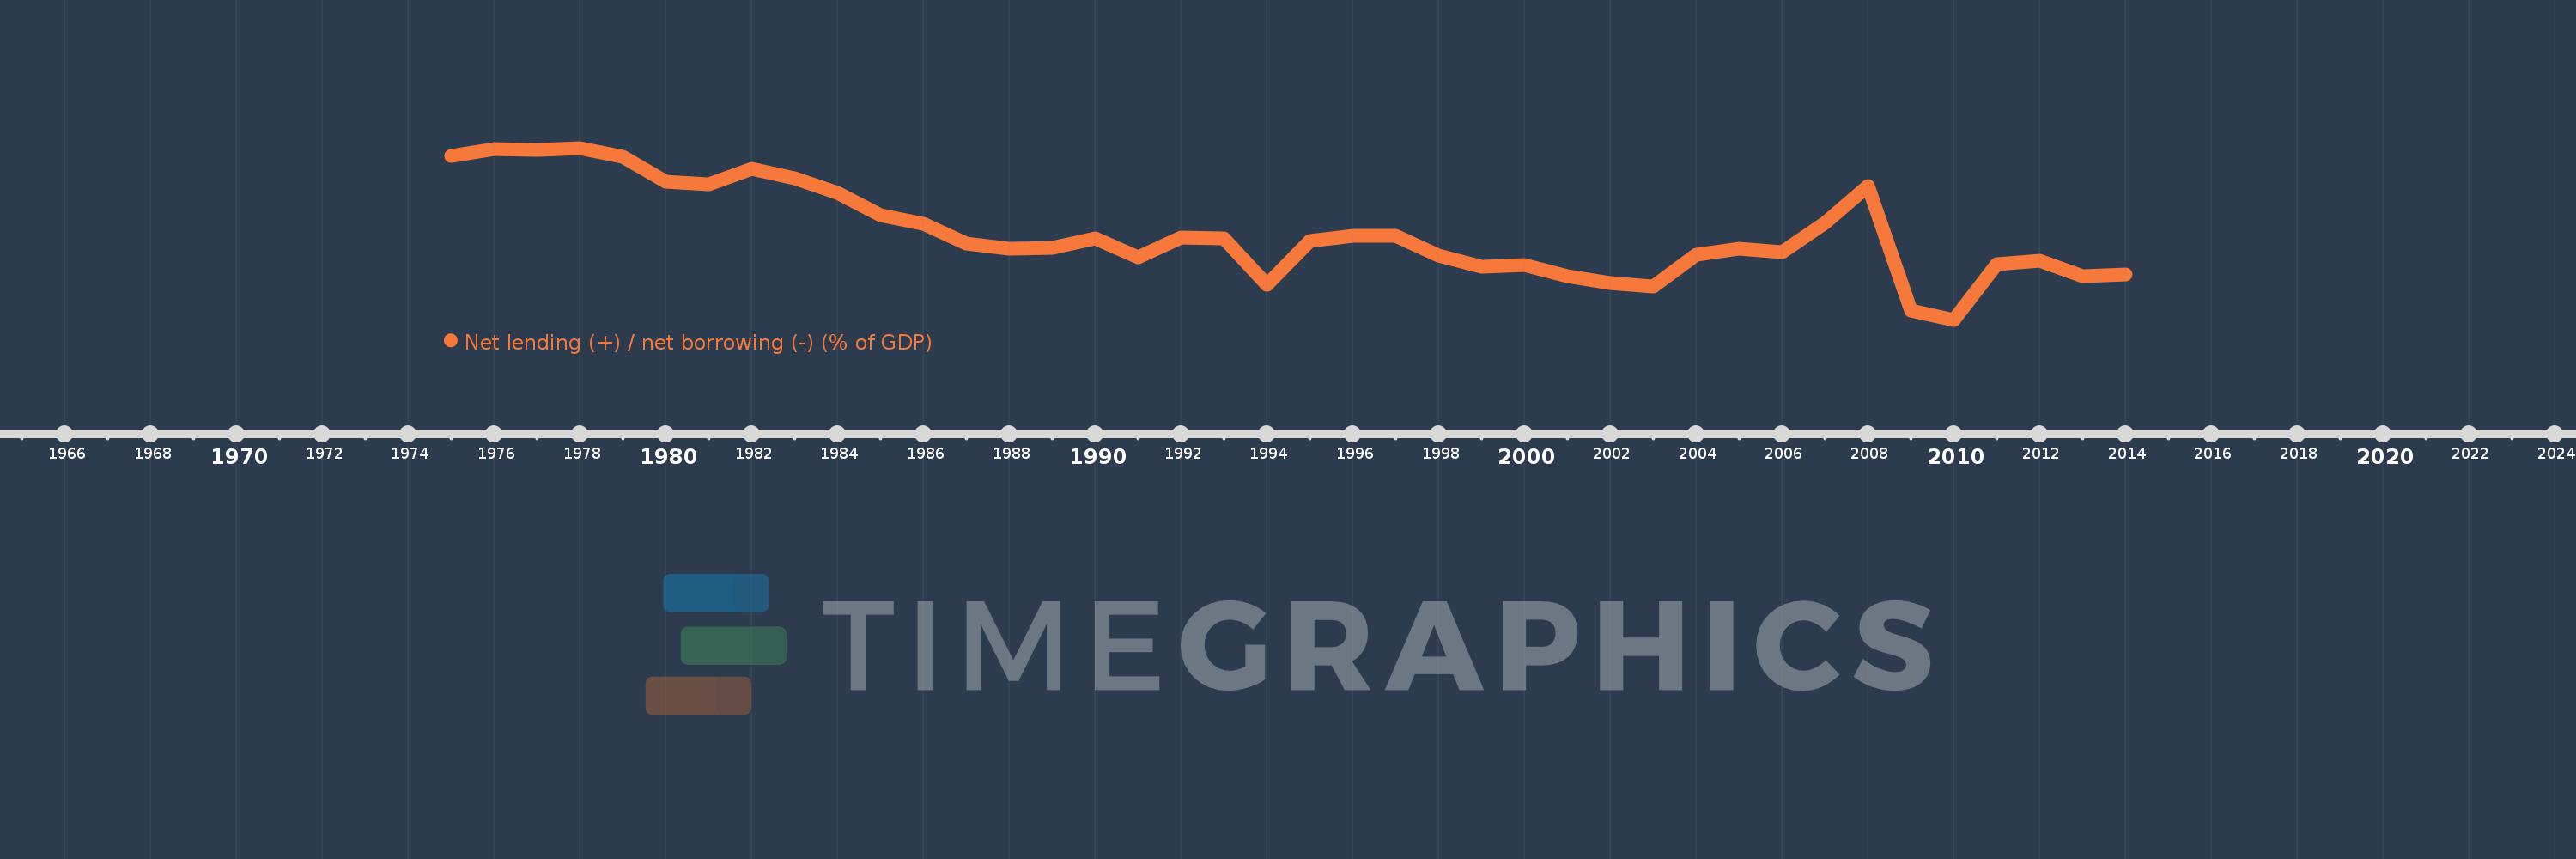
Net lending (+) / net borrowing (-) (% of GDP)
2014,2013,2012,2011,2010,2009,2008,2007,2006,2005,2004,2003,2002,2001,2000,1999,1998,1997,1996,1995,1994,1993,1992,1991,1990,1989,1988,1987,1986,1985,1984,1983,1982,1981,1980,1979,1978,1977,1976,1975
Estas estatísticas em outros países:
AfghanistanAlbaniaAlgeriaAngolaAntigua and BarbudaArmeniaAustraliaAustriaAzerbaijanBahamas, TheBahrainBangladeshBarbadosBelarusBelgiumBelizeBhutanBoliviaBosnia and HerzegovinaBrazilBurundiCabo VerdeCambodiaCanadaCaribbean small statesCentral African RepublicCentral Europe and the BalticsChileCongo, Dem. Rep.Congo, Rep.Costa RicaCote d'IvoireCroatiaCyprusCzech RepublicDenmarkDominicaDominican RepublicEarly-demographic dividendEgypt, Arab Rep.El SalvadorEquatorial GuineaEstoniaEthiopiaEuro areaEurope & Central AsiaEurope & Central Asia (excluding high income)Europe & Central Asia (IDA & IBRD countries)European UnionFijiFinlandFranceGambia, TheGeorgiaGermanyGreeceGuatemalaHigh incomeHondurasHungaryIcelandIDA blendIndiaIndonesiaIran, Islamic Rep.IraqIrelandIsraelItalyJamaicaKazakhstanKiribatiKorea, Rep.Kyrgyz RepublicLao PDRLatin America & Caribbean Latin America & Caribbean (excluding high income)Latin America & the Caribbean (IDA & IBRD countries)LatviaLebanonLithuaniaLower middle incomeLuxembourgMacao SAR, ChinaMacedonia, FYRMadagascarMalawiMaldivesMaliMaltaMauritiusMexicoMicronesia, Fed. Sts.Middle East & North Africa (excluding high income)Middle East & North Africa (IDA & IBRD countries)MoldovaMongoliaMoroccoMozambiqueNamibiaNepalNetherlandsNew ZealandNicaraguaNigeriaNorth AmericaNorwayOECD membersOmanOther small statesPacific island small statesPakistanParaguayPeruPhilippinesPolandPortugalPost-demographic dividendQatarRomaniaRussian FederationRwandaSamoaSan MarinoSao Tome and PrincipeSenegalSerbiaSierra LeoneSingaporeSlovak RepublicSmall statesSolomon IslandsSouth AfricaSouth AsiaSouth Asia (IDA & IBRD)SpainSri LankaSub-Saharan Africa Sub-Saharan Africa (excluding high income)Sub-Saharan Africa (IDA & IBRD countries)SurinameSwazilandSwedenSwitzerlandSyrian Arab RepublicThailandTimor-LesteTrinidad and TobagoTurkeyUgandaUkraineUnited Arab EmiratesUnited KingdomUnited StatesUruguayVanuatuVietnamWest Bank and GazaWorldYemen, Rep.Zimbabwe Linha do tempo:
Nesta escala de tempo está apresentado um gráfico de 1975 ano até 2014 ano South Asia. Dados de 1974 ano ausente. O número de observações reais por data: 40.
Fonte (nome):
Indicadores de desenvolvimento mundial
Fonte (organização):
International Monetary Fund, Government Finance Statistics Yearbook and data files.
Categorias:
Public Sector
Foi atualizado:
23 abr 2017 ano
Indicadores de alterações dos valores ao longo dos anos
Mínimo:
-5.288
1 jan 2010 ano
Máximo:
0.181
1 jan 1978 ano
Na data de observação
Valor
Mudança absoluta
A alteração em relação ao valor anterior
1 jan 1975 ano
-0.084
-0.084
0.0%
1 jan 1976 ano
0.148
+0.232
-275.35%
1 jan 1977 ano
0.126
-0.021
-14.44%
1 jan 1978 ano
0.181
+0.055
43.61%
1 jan 1979 ano
-0.106
-0.287
-158.18%
1 jan 1980 ano
-0.892
-0.786
744.79%
1 jan 1981 ano
-0.986
-0.095
10.63%
1 jan 1982 ano
-0.493
+0.493
-50.0%
1 jan 1983 ano
-0.773
-0.28
56.74%
1 jan 1984 ano
-1.256
-0.483
62.47%
1 jan 1985 ano
-1.963
-0.707
56.33%
1 jan 1986 ano
-2.237
-0.274
13.93%
1 jan 1987 ano
-2.866
-0.63
28.15%
1 jan 1988 ano
-3.025
-0.159
5.54%
1 jan 1989 ano
-3.005
+0.02
-0.67%
1 jan 1990 ano
-2.694
+0.311
-10.34%
1 jan 1991 ano
-3.296
-0.602
22.34%
1 jan 1992 ano
-2.678
+0.618
-18.76%
1 jan 1993 ano
-2.712
-0.035
1.3%
1 jan 1994 ano
-4.168
-1.455
53.66%
1 jan 1995 ano
-2.791
+1.376
-33.02%
1 jan 1996 ano
-2.617
+0.175
-6.25%
1 jan 1997 ano
-2.609
+0.008
-0.31%
1 jan 1998 ano
-3.247
-0.638
24.45%
1 jan 1999 ano
-3.59
-0.343
10.58%
1 jan 2000 ano
-3.534
+0.056
-1.55%
1 jan 2001 ano
-3.907
-0.373
10.54%
1 jan 2002 ano
-4.126
-0.219
5.6%
1 jan 2003 ano
-4.217
-0.091
2.21%
1 jan 2004 ano
-3.216
+1.001
-23.74%
1 jan 2005 ano
-3.021
+0.194
-6.05%
1 jan 2006 ano
-3.128
-0.106
3.52%
1 jan 2007 ano
-2.208
+0.919
-29.4%
1 jan 2008 ano
-1.017
+1.191
-53.93%
1 jan 2009 ano
-4.992
-3.974
390.63%
1 jan 2010 ano
-5.288
-0.297
5.94%
1 jan 2011 ano
-3.519
+1.769
-33.45%
1 jan 2012 ano
-3.396
+0.123
-3.5%
1 jan 2013 ano
-3.908
-0.512
15.08%
1 jan 2014 ano
-3.853
+0.055
-1.42%
Classificação de países por estatísticas atuais por anos


Comentários: