29
/pt/
pt
AIzaSyAYiBZKx7MnpbEhh9jyipgxe19OcubqV5w
April 1, 2024
57140
South Asia
SAS
false
2
1
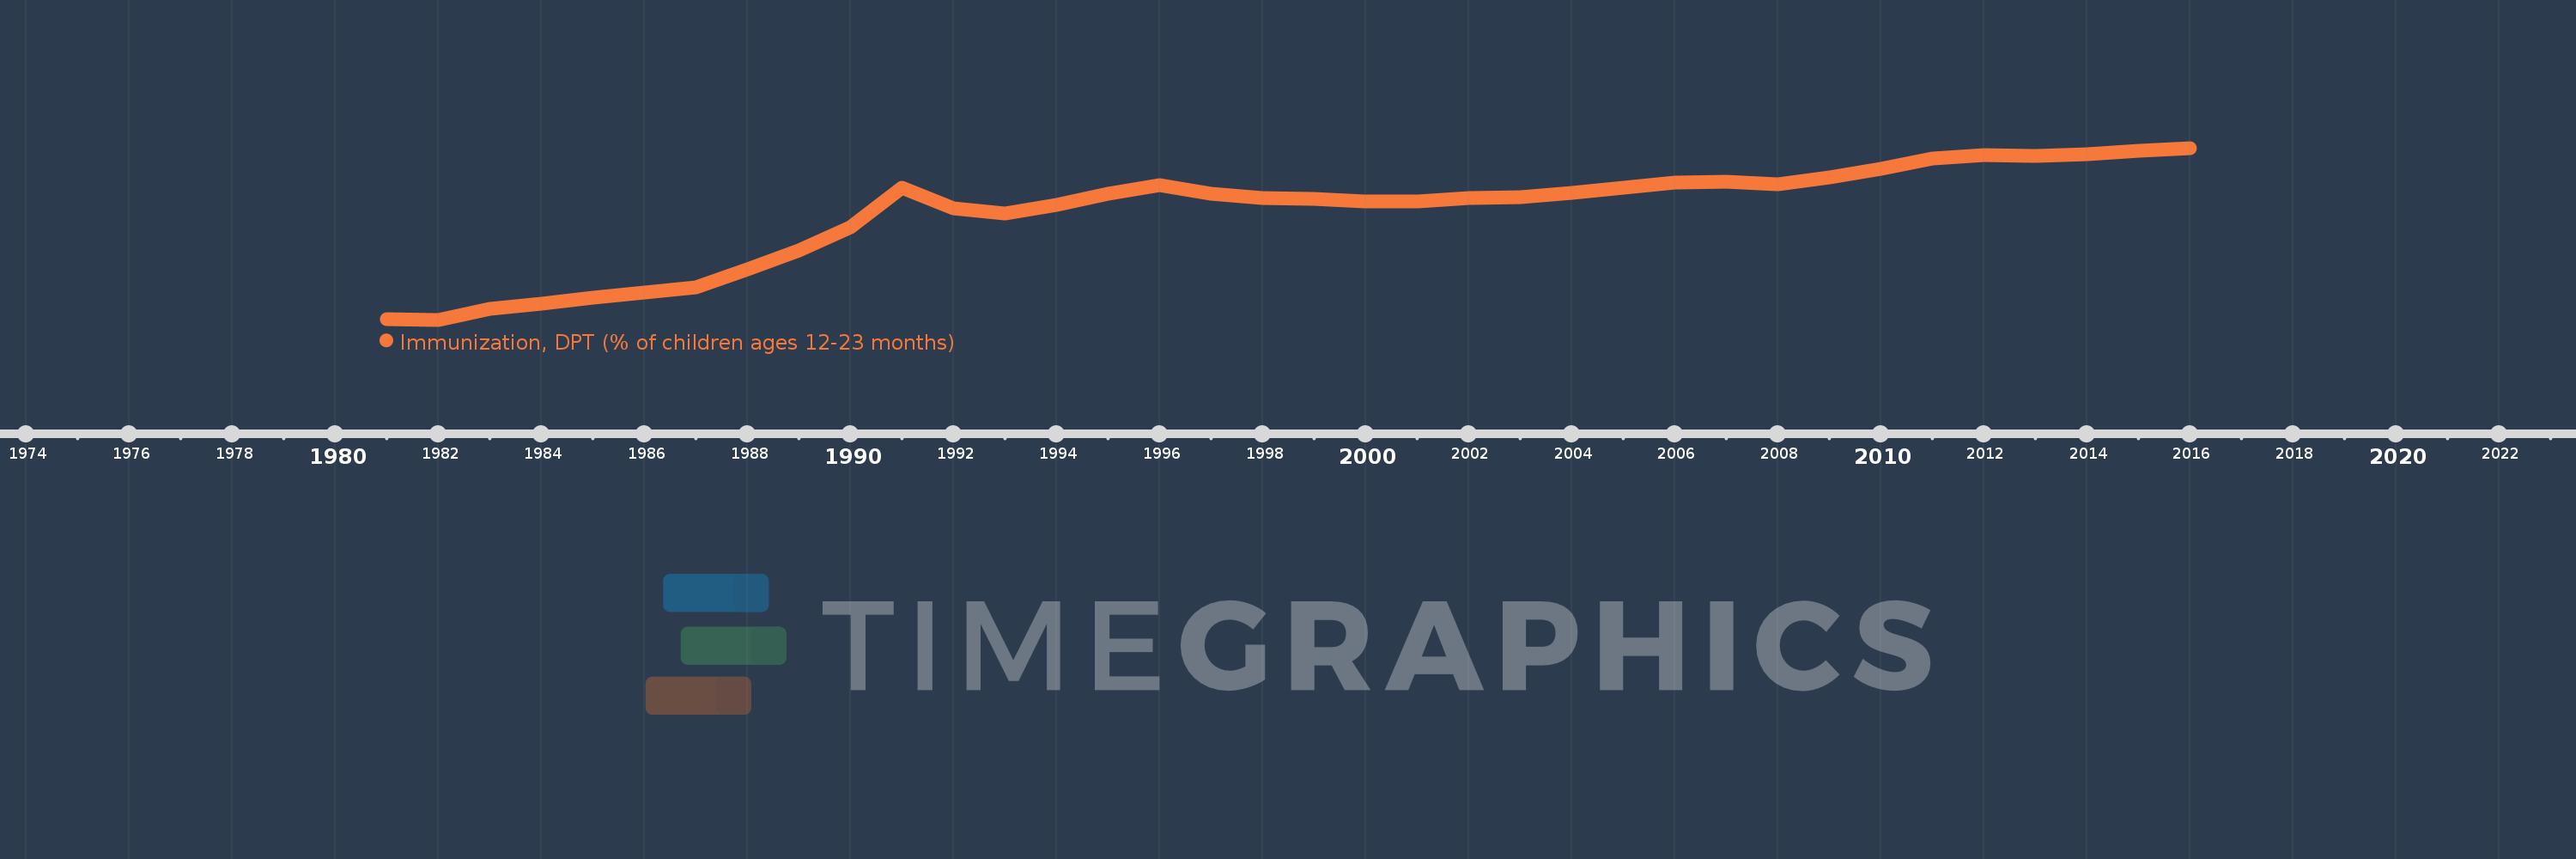
Immunization, DPT (% of children ages 12-23 months)
2016,2015,2014,2013,2012,2011,2010,2009,2008,2007,2006,2005,2004,2003,2002,2001,2000,1999,1998,1997,1996,1995,1994,1993,1992,1991,1990,1989,1988,1987,1986,1985,1984,1983,1982,1981
Estas estatísticas em outros países:
AfghanistanAlbaniaAlgeriaAndorraAngolaAntigua and BarbudaArab WorldArgentinaArmeniaAustraliaAustriaAzerbaijanBahamas, TheBahrainBangladeshBarbadosBelarusBelgiumBelizeBeninBhutanBoliviaBosnia and HerzegovinaBotswanaBrazilBrunei DarussalamBulgariaBurkina FasoBurundiCabo VerdeCambodiaCameroonCanadaCaribbean small statesCentral African RepublicCentral Europe and the BalticsChadChileChinaColombiaComorosCongo, Dem. Rep.Congo, Rep.Costa RicaCote d'IvoireCroatiaCubaCyprusCzech RepublicDenmarkDjiboutiDominicaDominican RepublicEarly-demographic dividendEast Asia & PacificEast Asia & Pacific (excluding high income)East Asia & Pacific (IDA & IBRD countries)EcuadorEgypt, Arab Rep.El SalvadorEquatorial GuineaEritreaEstoniaEthiopiaEuro areaEurope & Central AsiaEurope & Central Asia (excluding high income)Europe & Central Asia (IDA & IBRD countries)European UnionFijiFinlandFragile and conflict affected situationsFranceGabonGambia, TheGeorgiaGermanyGhanaGreeceGrenadaGuatemalaGuineaGuinea-BissauGuyanaHaitiHeavily indebted poor countries (HIPC)High incomeHondurasHungaryIBRD onlyIcelandIDA & IBRD totalIDA blendIDA onlyIDA totalIndiaIndonesiaIran, Islamic Rep.IraqIrelandIsraelItalyJamaicaJapanJordanKazakhstanKenyaKiribatiKorea, Dem. People’s Rep.Korea, Rep.KuwaitKyrgyz RepublicLao PDRLate-demographic dividendLatin America & Caribbean Latin America & Caribbean (excluding high income)Latin America & the Caribbean (IDA & IBRD countries)LatviaLeast developed countries: UN classificationLebanonLesothoLiberiaLibyaLithuaniaLow & middle incomeLow incomeLower middle incomeLuxembourgMacedonia, FYRMadagascarMalawiMalaysiaMaldivesMaliMaltaMarshall IslandsMauritaniaMauritiusMexicoMicronesia, Fed. Sts.Middle East & North AfricaMiddle East & North Africa (excluding high income)Middle East & North Africa (IDA & IBRD countries)Middle incomeMoldovaMonacoMongoliaMontenegroMoroccoMozambiqueMyanmarNamibiaNauruNepalNetherlandsNew ZealandNicaraguaNigerNigeriaNorth AmericaNorwayOECD membersOmanOther small statesPacific island small statesPakistanPalauPanamaPapua New GuineaParaguayPeruPhilippinesPolandPortugalPost-demographic dividendPre-demographic dividendQatarRomaniaRussian FederationRwandaSamoaSan MarinoSao Tome and PrincipeSaudi ArabiaSenegalSerbiaSeychellesSierra LeoneSingaporeSlovak RepublicSloveniaSmall statesSolomon IslandsSomaliaSouth AfricaSouth AsiaSouth Asia (IDA & IBRD)South SudanSpainSri LankaSt. Kitts and NevisSt. LuciaSt. Vincent and the GrenadinesSub-Saharan Africa Sub-Saharan Africa (excluding high income)Sub-Saharan Africa (IDA & IBRD countries)SudanSurinameSwazilandSwedenSwitzerlandSyrian Arab RepublicTajikistanTanzaniaThailandTimor-LesteTogoTongaTrinidad and TobagoTunisiaTurkeyTurkmenistanTuvaluUgandaUkraineUnited Arab EmiratesUnited KingdomUnited StatesUpper middle incomeUruguayUzbekistanVanuatuVenezuela, RBVietnamWorldYemen, Rep.ZambiaZimbabwe Linha do tempo:
Nesta escala de tempo está apresentado um gráfico de 1981 ano até 2016 ano South Asia. Dados de 1980 ano ausente. O número de observações reais por data: 36.
Fonte (nome):
Indicadores de desenvolvimento mundial
Fonte (organização):
WHO and UNICEF (http://www.who.int/immunization/monitoring_surveillance/en/).
Categorias:
Health
Foi atualizado:
23 abr 2017 ano
Indicadores de alterações dos valores ao longo dos anos
Mínimo:
5.841
1 jan 1982 ano
Máximo:
85.365
1 jan 2016 ano
Na data de observação
Valor
Mudança absoluta
A alteração em relação ao valor anterior
1 jan 1981 ano
6.182
+6.182
0.0%
1 jan 1982 ano
5.841
-0.341
-5.52%
1 jan 1983 ano
10.753
+4.912
84.09%
1 jan 1984 ano
13.426
+2.673
24.86%
1 jan 1985 ano
16.01
+2.584
19.24%
1 jan 1986 ano
18.466
+2.456
15.34%
1 jan 1987 ano
20.72
+2.254
12.21%
1 jan 1988 ano
29.313
+8.593
41.47%
1 jan 1989 ano
37.887
+8.574
29.25%
1 jan 1990 ano
48.838
+10.951
28.9%
1 jan 1991 ano
67.074
+18.236
37.34%
1 jan 1992 ano
57.46
-9.614
-14.33%
1 jan 1993 ano
55.009
-2.451
-4.26%
1 jan 1994 ano
58.853
+3.843
6.99%
1 jan 1995 ano
64.358
+5.506
9.36%
1 jan 1996 ano
68.181
+3.822
5.94%
1 jan 1997 ano
64.319
-3.862
-5.66%
1 jan 1998 ano
62.345
-1.974
-3.07%
1 jan 1999 ano
61.636
-0.709
-1.14%
1 jan 2000 ano
60.702
-0.934
-1.52%
1 jan 2001 ano
60.707
+0.005
0.01%
1 jan 2002 ano
62.205
+1.498
2.47%
1 jan 2003 ano
62.402
+0.197
0.32%
1 jan 2004 ano
64.372
+1.97
3.16%
1 jan 2005 ano
66.985
+2.613
4.06%
1 jan 2006 ano
69.358
+2.373
3.54%
1 jan 2007 ano
69.8
+0.442
0.64%
1 jan 2008 ano
68.724
-1.077
-1.54%
1 jan 2009 ano
71.701
+2.978
4.33%
1 jan 2010 ano
75.855
+4.154
5.79%
1 jan 2011 ano
80.6
+4.745
6.26%
1 jan 2012 ano
82.054
+1.454
1.8%
1 jan 2013 ano
81.552
-0.502
-0.61%
1 jan 2014 ano
82.356
+0.804
0.99%
1 jan 2015 ano
83.898
+1.542
1.87%
1 jan 2016 ano
85.365
+1.467
1.75%
Classificação de países por estatísticas atuais por anos


Comentários: