30
/pt/
AIzaSyAYiBZKx7MnpbEhh9jyipgxe19OcubqV5w
April 1, 2024
56796
South Asia
SAS
false
2
1
Average transaction cost of sending remittances to a specific country (%)
2016,2015,2014,2013,2012
Download
Biblioteca de estatísticas globais →South Asia →

Average transaction cost of sending remittances to a specific country (%)

Estas estatísticas em outros países:

AfghanistanAlbaniaAlgeriaAngolaArab WorldArmeniaAzerbaijanBangladeshBelarusBoliviaBosnia and HerzegovinaBotswanaBrazilBulgariaCabo VerdeCambodiaCameroonCaribbean small statesCentral Europe and the BalticsChinaColombiaCongo, Rep.Costa RicaCote d'IvoireCroatiaDominican RepublicEarly-demographic dividendEast Asia & Pacific (excluding high income)East Asia & Pacific (IDA & IBRD countries)EcuadorEgypt, Arab Rep.El SalvadorEritreaEstoniaEthiopiaEurope & Central AsiaEurope & Central Asia (excluding high income)Europe & Central Asia (IDA & IBRD countries)FijiFragile and conflict affected situationsGambia, TheGeorgiaGhanaGuatemalaGuyanaHaitiHeavily indebted poor countries (HIPC)HondurasHungaryIBRD onlyIDA & IBRD totalIDA blendIDA onlyIDA totalIndiaIndonesiaJamaicaJordanKazakhstanKenyaKiribatiKorea, Rep.KosovoKyrgyz RepublicLao PDRLate-demographic dividendLatin America & Caribbean Latin America & Caribbean (excluding high income)Latin America & the Caribbean (IDA & IBRD countries)LatviaLeast developed countries: UN classificationLebanonLesothoLiberiaLithuaniaLow & middle incomeLow incomeLower middle incomeMacedonia, FYRMadagascarMalawiMalaysiaMaliMexicoMiddle East & North Africa (excluding high income)Middle East & North Africa (IDA & IBRD countries)Middle incomeMoldovaMoroccoMozambiqueMyanmarNepalNicaraguaNigeriaPakistanPanamaPapua New GuineaParaguayPeruPhilippinesPolandPre-demographic dividendRomaniaRwandaSamoaSenegalSerbiaSierra LeoneSolomon IslandsSomaliaSouth AfricaSouth AsiaSouth Asia (IDA & IBRD)Sri LankaSub-Saharan Africa Sub-Saharan Africa (excluding high income)Sub-Saharan Africa (IDA & IBRD countries)SudanSurinameSwazilandSyrian Arab RepublicTajikistanTanzaniaThailandTogoTongaTunisiaTurkeyTuvaluUgandaUkraineUpper middle incomeUzbekistanVanuatuVietnamWorldYemen, Rep.ZambiaZimbabwe

Linha do tempo:

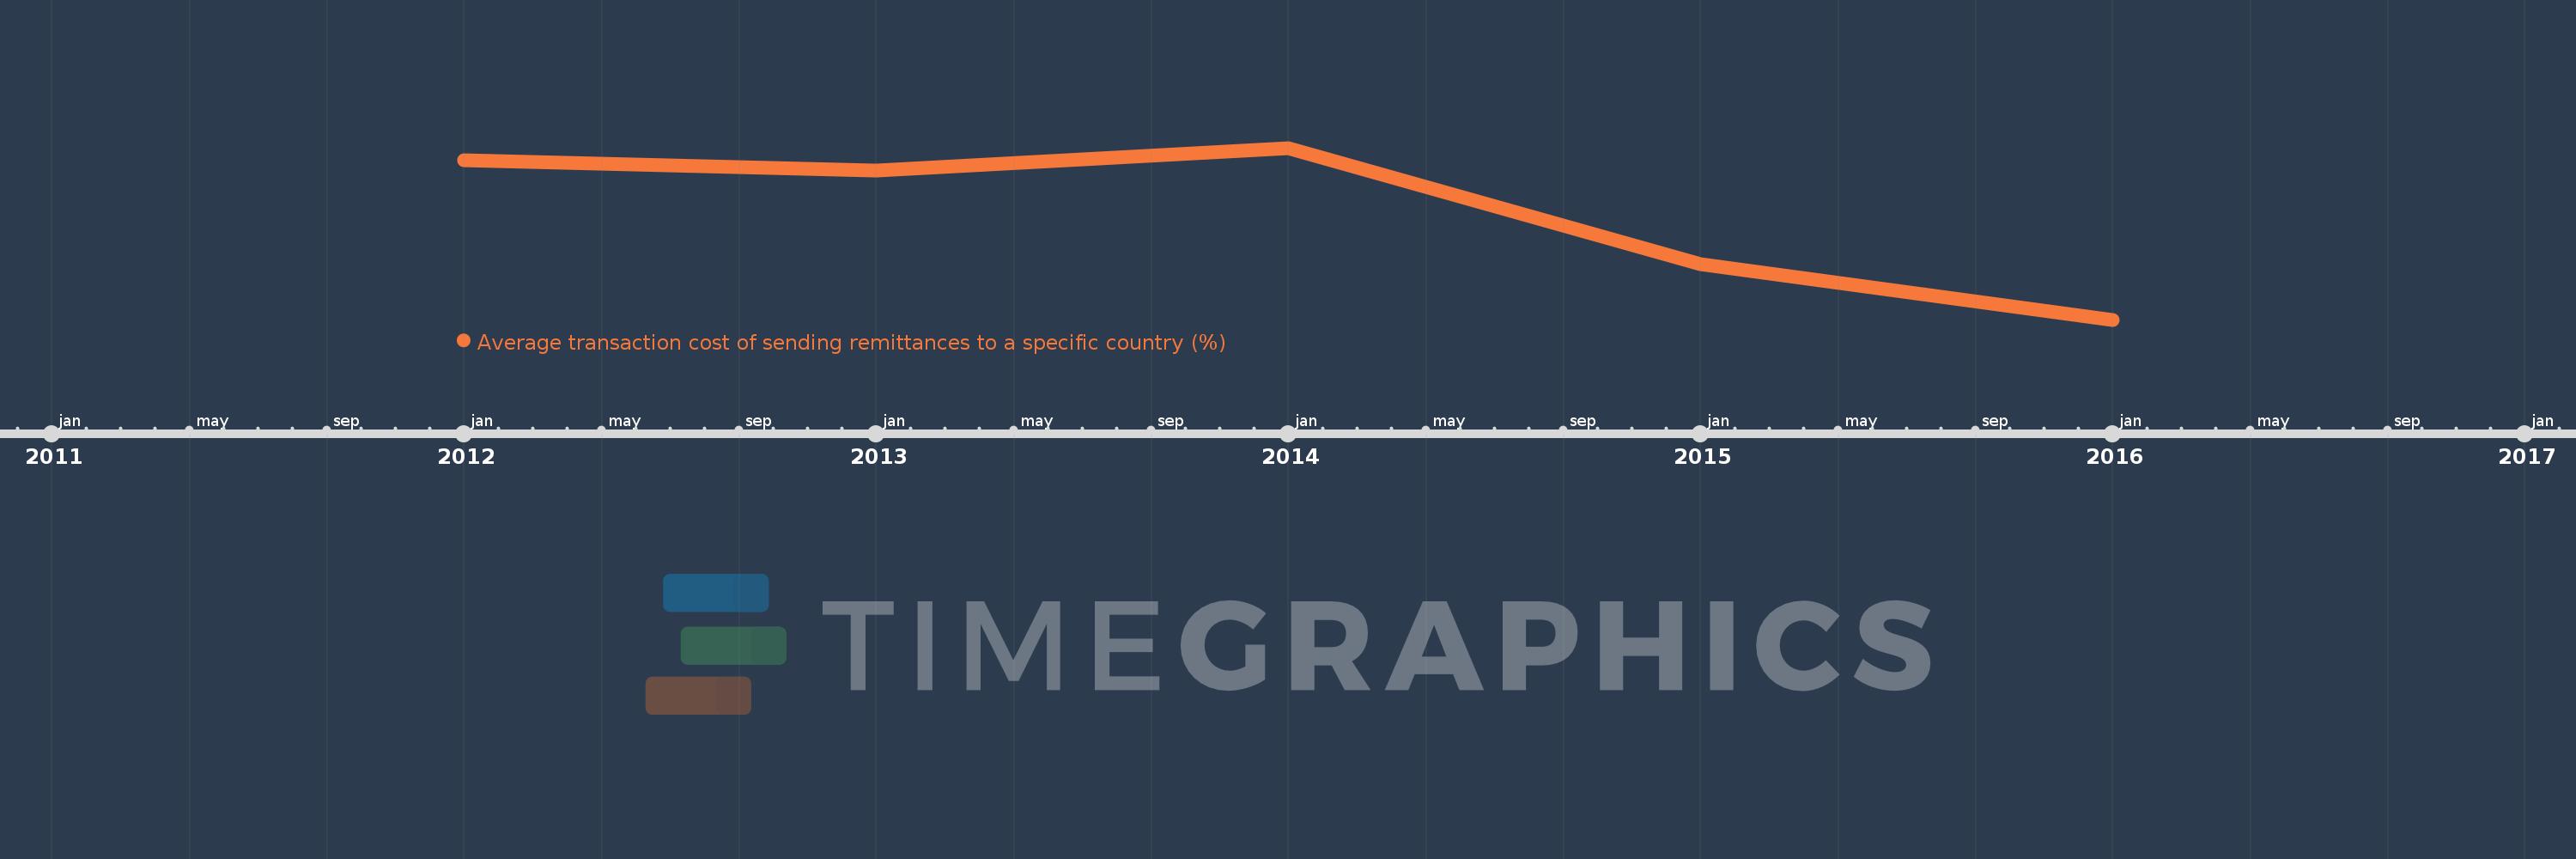
Nesta escala de tempo está apresentado um gráfico de 2012 ano até 2016 ano South Asia. Dados de 2011 ano ausente. O número de observações reais por data: 5.

Fonte (nome):

Indicadores de desenvolvimento mundial

Fonte (organização):

World Bank, Remittance Prices Worldwide, available at http://remittanceprices.worldbank.org

Categorias:

Financial Sector

Foi atualizado:

23 abr 2017 ano

Indicadores de alterações dos valores ao longo dos anos

Em média:
5.89
Mínimo:
5.535
1 jan 2016 ano
Máximo:
6.103
1 jan 2014 ano
Na data de observação
Valor
Mudança absoluta
A alteração em relação ao valor anterior
1 jan 2012 ano
6.061
+6.061
0.0%
1 jan 2013 ano
6.029
-0.033
-0.54%
1 jan 2014 ano
6.103
+0.075
1.24%
1 jan 2015 ano
5.72
-0.384
-6.29%
1 jan 2016 ano
5.535
-0.185
-3.23%

Classificação de países por estatísticas atuais por anos