29
/pt/
pt
AIzaSyAYiBZKx7MnpbEhh9jyipgxe19OcubqV5w
April 1, 2024
54780
Post-demographic dividend
PST
false
2
1
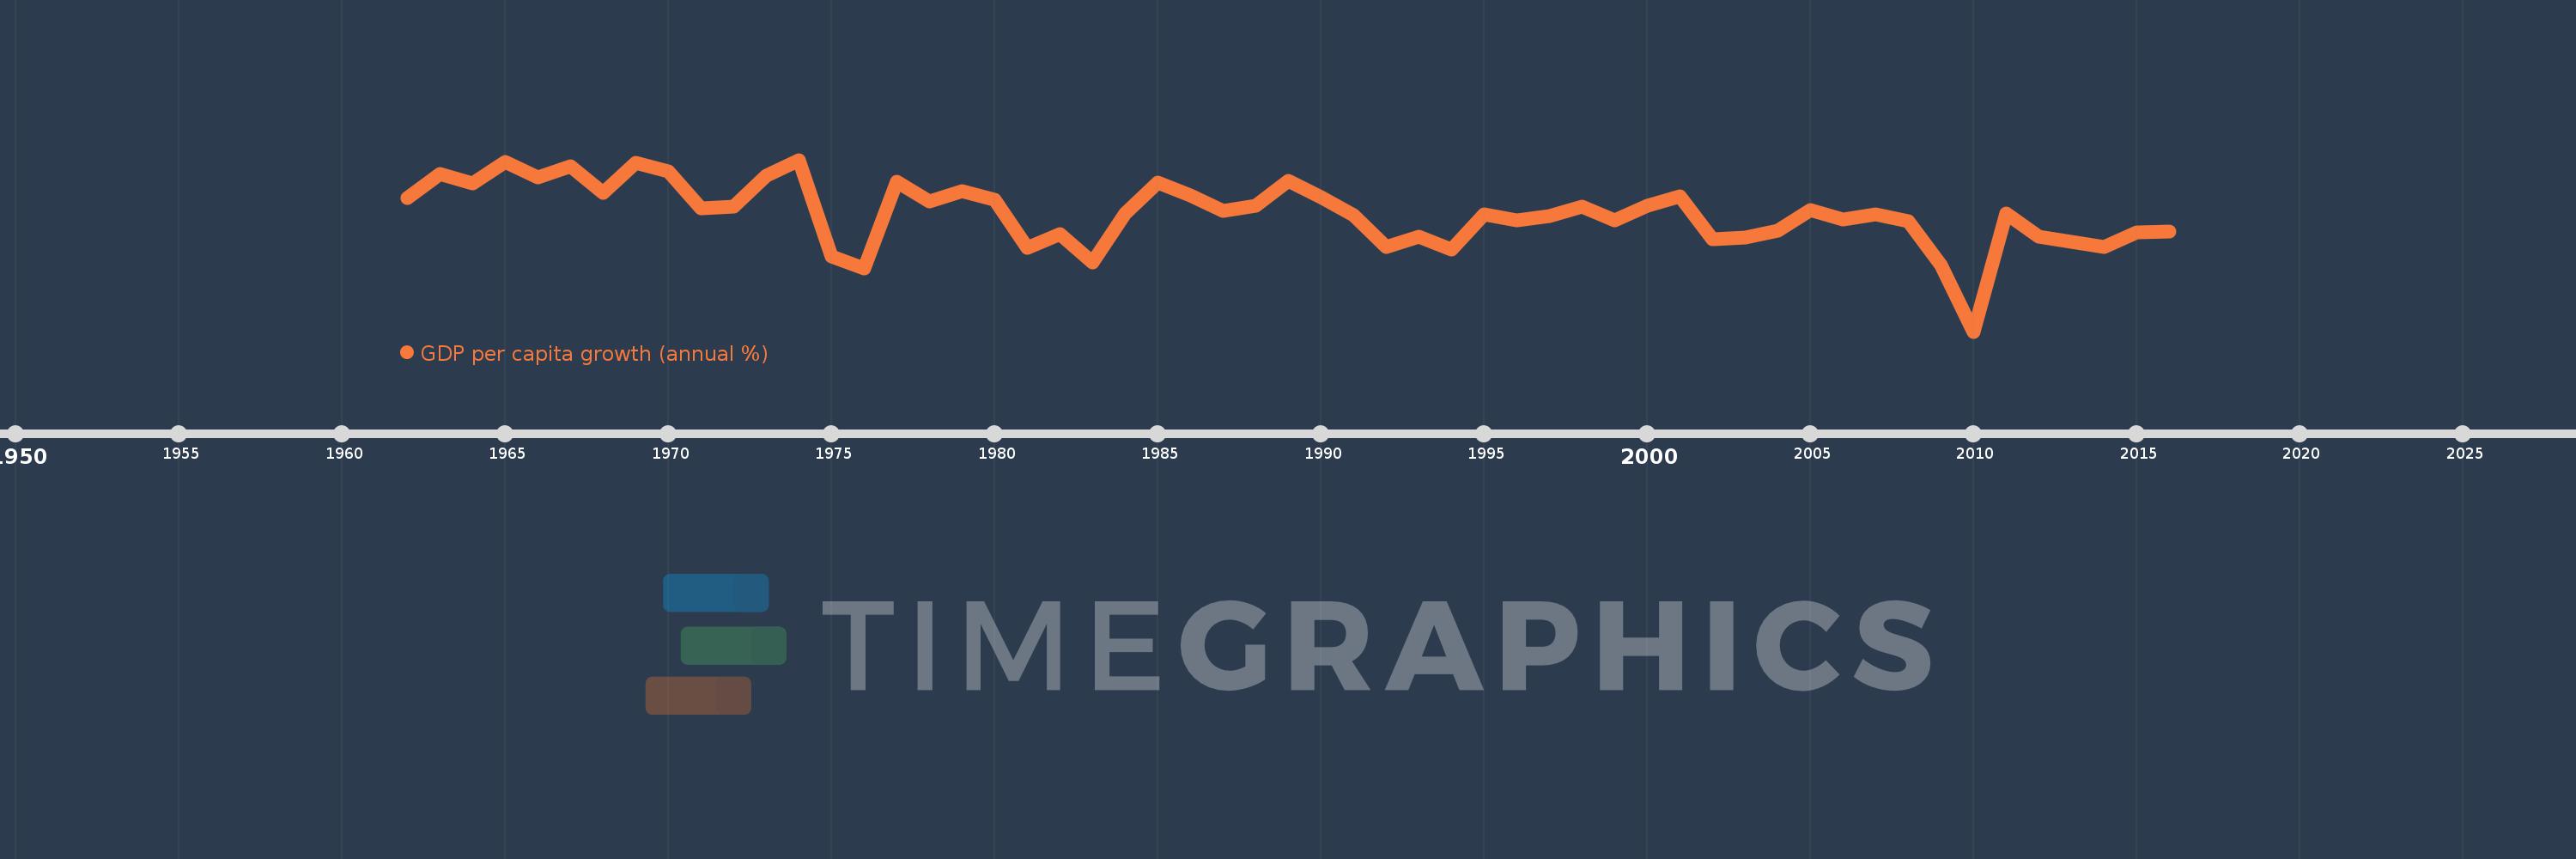
GDP per capita growth (annual %)
2016,2015,2014,2013,2012,2011,2010,2009,2008,2007,2006,2005,2004,2003,2002,2001,2000,1999,1998,1997,1996,1995,1994,1993,1992,1991,1990,1989,1988,1987,1986,1985,1984,1983,1982,1981,1980,1979,1978,1977,1976,1975,1974,1973,1972,1971,1970,1969,1968,1967,1966,1965,1964,1963,1962
Estas estatísticas em outros países:
AfghanistanAlbaniaAlgeriaAndorraAngolaAntigua and BarbudaArab WorldArgentinaArmeniaArubaAustraliaAustriaAzerbaijanBahamas, TheBahrainBangladeshBarbadosBelarusBelgiumBelizeBeninBermudaBhutanBoliviaBosnia and HerzegovinaBotswanaBrazilBrunei DarussalamBulgariaBurkina FasoBurundiCabo VerdeCambodiaCameroonCanadaCaribbean small statesCayman IslandsCentral African RepublicCentral Europe and the BalticsChadChannel IslandsChileChinaColombiaComorosCongo, Dem. Rep.Congo, Rep.Costa RicaCote d'IvoireCroatiaCubaCyprusCzech RepublicDenmarkDjiboutiDominicaDominican RepublicEarly-demographic dividendEast Asia & PacificEast Asia & Pacific (excluding high income)East Asia & Pacific (IDA & IBRD countries)EcuadorEgypt, Arab Rep.El SalvadorEquatorial GuineaEritreaEstoniaEthiopiaEuro areaEurope & Central AsiaEurope & Central Asia (excluding high income)Europe & Central Asia (IDA & IBRD countries)European UnionFijiFinlandFragile and conflict affected situationsFranceFrench PolynesiaGabonGambia, TheGeorgiaGermanyGhanaGreeceGreenlandGrenadaGuatemalaGuineaGuinea-BissauGuyanaHaitiHeavily indebted poor countries (HIPC)High incomeHondurasHong Kong SAR, ChinaHungaryIBRD onlyIcelandIDA & IBRD totalIDA blendIDA onlyIDA totalIndiaIndonesiaIran, Islamic Rep.IraqIrelandIsle of ManIsraelItalyJamaicaJapanJordanKazakhstanKenyaKiribatiKorea, Rep.KosovoKuwaitKyrgyz RepublicLao PDRLate-demographic dividendLatin America & Caribbean Latin America & Caribbean (excluding high income)Latin America & the Caribbean (IDA & IBRD countries)LatviaLeast developed countries: UN classificationLebanonLesothoLiberiaLibyaLiechtensteinLithuaniaLow & middle incomeLow incomeLower middle incomeLuxembourgMacao SAR, ChinaMacedonia, FYRMadagascarMalawiMalaysiaMaldivesMaliMaltaMarshall IslandsMauritaniaMauritiusMexicoMicronesia, Fed. Sts.Middle East & North AfricaMiddle East & North Africa (excluding high income)Middle East & North Africa (IDA & IBRD countries)Middle incomeMoldovaMonacoMongoliaMontenegroMoroccoMozambiqueMyanmarNamibiaNauruNepalNetherlandsNew CaledoniaNew ZealandNicaraguaNigerNigeriaNorth AmericaNorwayOECD membersOmanOther small statesPacific island small statesPakistanPalauPanamaPapua New GuineaParaguayPeruPhilippinesPolandPortugalPost-demographic dividendPre-demographic dividendPuerto RicoQatarRomaniaRussian FederationRwandaSamoaSan MarinoSao Tome and PrincipeSaudi ArabiaSenegalSerbiaSeychellesSierra LeoneSingaporeSlovak RepublicSloveniaSmall statesSolomon IslandsSomaliaSouth AfricaSouth AsiaSouth Asia (IDA & IBRD)South SudanSpainSri LankaSt. Kitts and NevisSt. LuciaSt. Vincent and the GrenadinesSub-Saharan Africa Sub-Saharan Africa (excluding high income)Sub-Saharan Africa (IDA & IBRD countries)SudanSurinameSwazilandSwedenSwitzerlandSyrian Arab RepublicTajikistanTanzaniaThailandTimor-LesteTogoTongaTrinidad and TobagoTunisiaTurkeyTurkmenistanTuvaluUgandaUkraineUnited Arab EmiratesUnited KingdomUnited StatesUpper middle incomeUruguayUzbekistanVanuatuVenezuela, RBVietnamVirgin Islands (U.S.)West Bank and GazaWorldYemen, Rep.ZambiaZimbabwe Linha do tempo:
Nesta escala de tempo está apresentado um gráfico de 1962 ano até 2016 ano Post-demographic dividend. Dados de 1961 ano ausente. O número de observações reais por data: 55.
Fonte (nome):
Indicadores de desenvolvimento mundial
Fonte (organização):
World Bank national accounts data, and OECD National Accounts data files.
Categorias:
Economy & Growth
Foi atualizado:
23 abr 2017 ano
Indicadores de alterações dos valores ao longo dos anos
Mínimo:
-4.098
1 jan 2010 ano
Máximo:
5.347
1 jan 1974 ano
Na data de observação
Valor
Mudança absoluta
A alteração em relação ao valor anterior
1 jan 1962 ano
3.236
+3.236
0.0%
1 jan 1963 ano
4.58
+1.344
41.52%
1 jan 1964 ano
4.026
-0.553
-12.09%
1 jan 1965 ano
5.245
+1.219
30.27%
1 jan 1966 ano
4.384
-0.861
-16.41%
1 jan 1967 ano
4.98
+0.596
13.59%
1 jan 1968 ano
3.548
-1.432
-28.76%
1 jan 1969 ano
5.19
+1.643
46.3%
1 jan 1970 ano
4.693
-0.497
-9.58%
1 jan 1971 ano
2.656
-2.038
-43.41%
1 jan 1972 ano
2.772
+0.116
4.37%
1 jan 1973 ano
4.454
+1.682
60.69%
1 jan 1974 ano
5.347
+0.893
20.05%
1 jan 1975 ano
0.041
-5.306
-99.23%
1 jan 1976 ano
-0.65
-0.691
-1.68 mil%
1 jan 1977 ano
4.148
+4.798
-738.19%
1 jan 1978 ano
3.053
-1.096
-26.41%
1 jan 1979 ano
3.6
+0.548
17.94%
1 jan 1980 ano
3.174
-0.426
-11.83%
1 jan 1981 ano
0.504
-2.67
-84.11%
1 jan 1982 ano
1.281
+0.777
153.98%
1 jan 1983 ano
-0.284
-1.566
-122.2%
1 jan 1984 ano
2.417
+2.701
-949.74%
1 jan 1985 ano
4.116
+1.699
70.31%
1 jan 1986 ano
3.389
-0.727
-17.66%
1 jan 1987 ano
2.535
-0.854
-25.2%
1 jan 1988 ano
2.844
+0.309
12.19%
1 jan 1989 ano
4.192
+1.348
47.39%
1 jan 1990 ano
3.276
-0.916
-21.85%
1 jan 1991 ano
2.278
-0.998
-30.46%
1 jan 1992 ano
0.571
-1.707
-74.92%
1 jan 1993 ano
1.119
+0.547
95.76%
1 jan 1994 ano
0.411
-0.708
-63.27%
1 jan 1995 ano
2.371
+1.96
476.91%
1 jan 1996 ano
2.021
-0.35
-14.76%
1 jan 1997 ano
2.235
+0.214
10.59%
1 jan 1998 ano
2.768
+0.533
23.85%
1 jan 1999 ano
2.017
-0.75
-27.11%
1 jan 2000 ano
2.833
+0.815
40.41%
1 jan 2001 ano
3.346
+0.513
18.11%
1 jan 2002 ano
1.001
-2.345
-70.09%
1 jan 2003 ano
1.057
+0.056
5.63%
1 jan 2004 ano
1.464
+0.407
38.47%
1 jan 2005 ano
2.602
+1.139
77.78%
1 jan 2006 ano
2.049
-0.553
-21.25%
1 jan 2007 ano
2.336
+0.287
14.0%
1 jan 2008 ano
1.976
-0.36
-15.4%
1 jan 2009 ano
-0.446
-2.422
-122.57%
1 jan 2010 ano
-4.098
-3.652
818.9%
1 jan 2011 ano
2.375
+6.473
-157.96%
1 jan 2012 ano
1.107
-1.268
-53.39%
1 jan 2013 ano
0.842
-0.265
-23.96%
1 jan 2014 ano
0.564
-0.278
-32.99%
1 jan 2015 ano
1.357
+0.793
140.65%
1 jan 2016 ano
1.411
+0.054
3.98%
Classificação de países por estatísticas atuais por anos


Comentários: