29
/pt/
pt
AIzaSyAYiBZKx7MnpbEhh9jyipgxe19OcubqV5w
April 1, 2024
50584
Middle East & North Africa (IDA & IBRD countries)
TMN
false
2
1
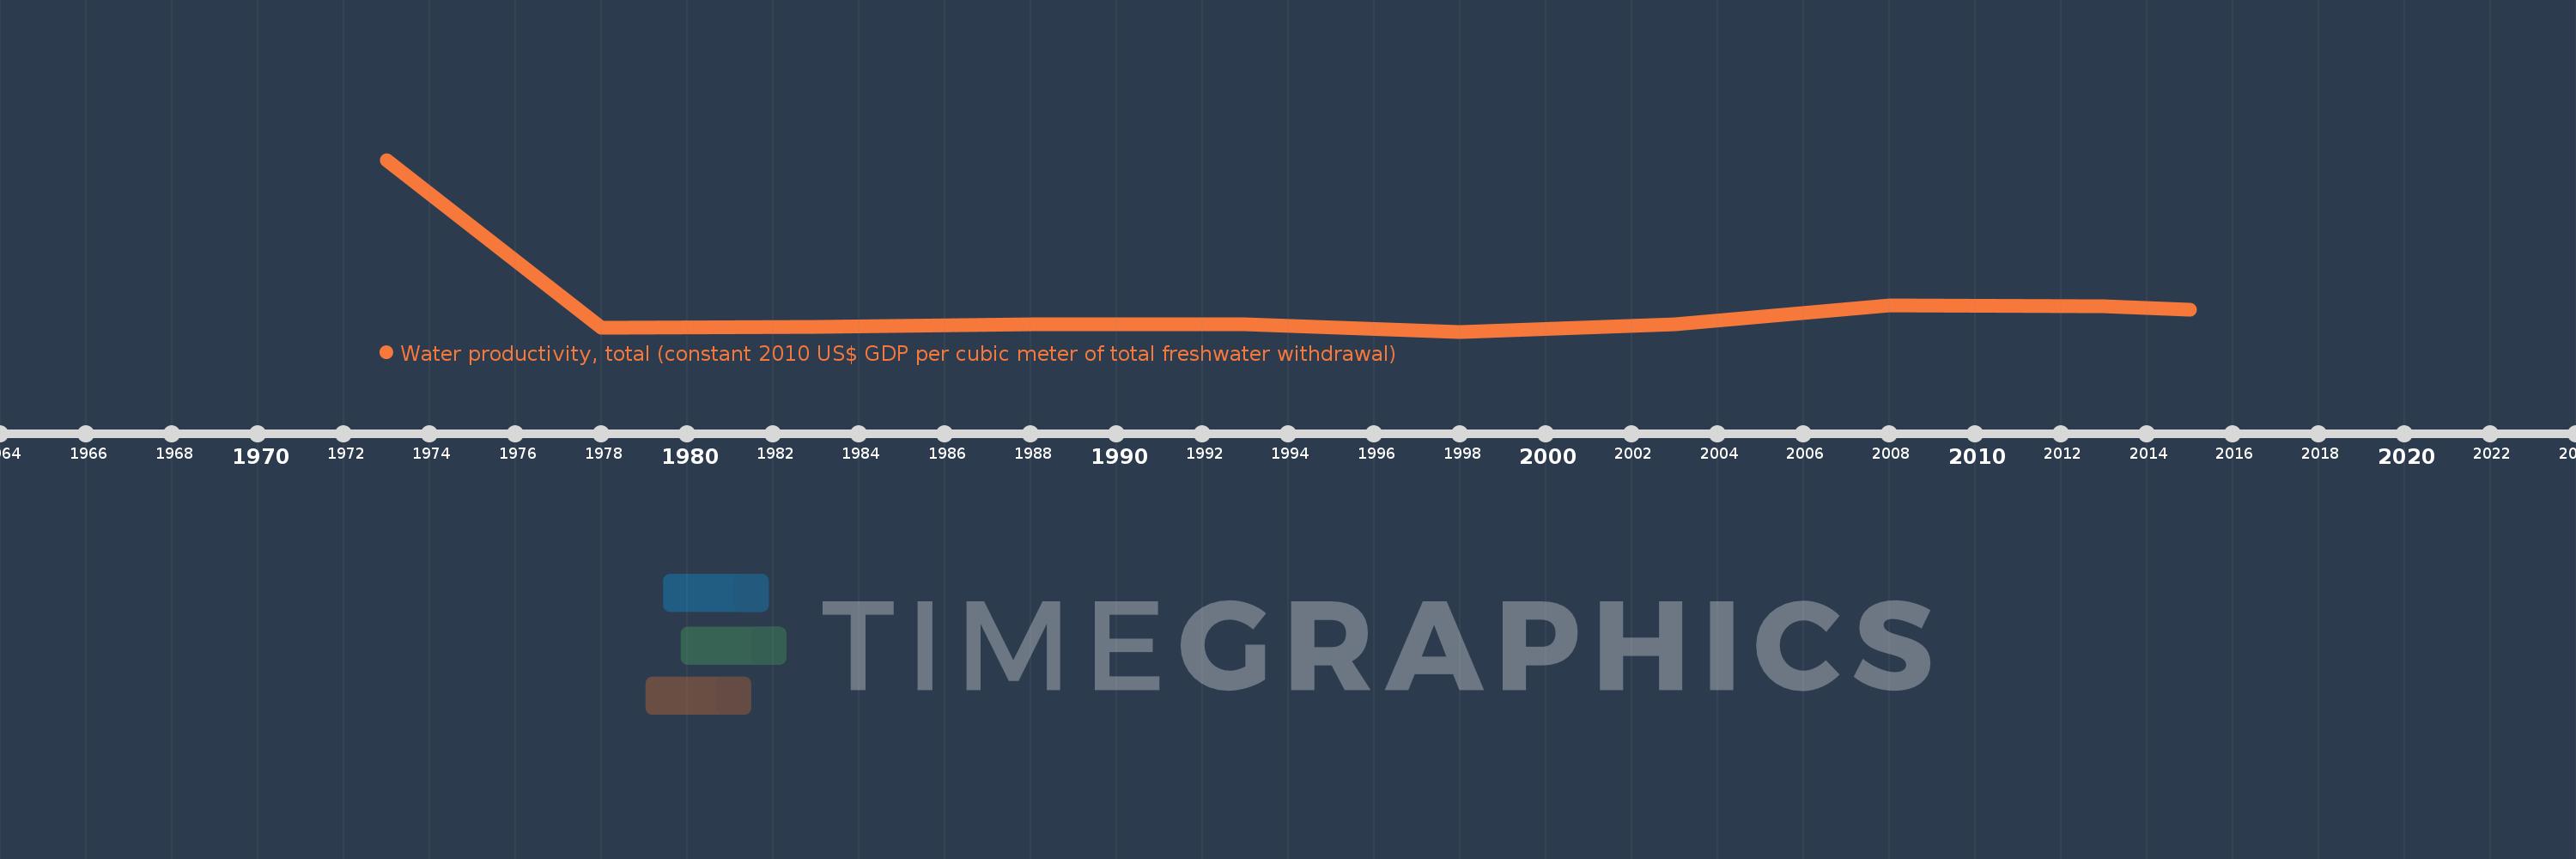
Water productivity, total (constant 2010 US$ GDP per cubic meter of total freshwater withdrawal)
2015,2013,2008,2003,1998,1993,1988,1983,1978,1973
Estas estatísticas em outros países:
Linha do tempo:
Nesta escala de tempo está apresentado um gráfico de 1973 ano até 2015 ano Middle East & North Africa (IDA & IBRD countries). Dados de 1972 ano ausente. O número de observações reais por data: 10.
Fonte (nome):
Indicadores de desenvolvimento mundial
Fonte (organização):
Food and Agriculture Organization, AQUASTAT data, and World Bank and OECD GDP estimates.
Categorias:
Environment
Foi atualizado:
23 abr 2017 ano
Indicadores de alterações dos valores ao longo dos anos
Mínimo:
2.524
1 jan 1998 ano
Máximo:
22.133
1 jan 1973 ano
Na data de observação
Valor
Mudança absoluta
A alteração em relação ao valor anterior
1 jan 1973 ano
22.133
+22.133
0.0%
1 jan 1978 ano
3.011
-19.121
-86.39%
1 jan 1983 ano
3.098
+0.087
2.89%
1 jan 1988 ano
3.389
+0.291
9.38%
1 jan 1993 ano
3.312
-0.077
-2.27%
1 jan 1998 ano
2.524
-0.788
-23.8%
1 jan 2003 ano
3.355
+0.831
32.91%
1 jan 2008 ano
5.517
+2.163
64.47%
1 jan 2013 ano
5.444
-0.073
-1.33%
1 jan 2015 ano
4.983
-0.461
-8.46%
Classificação de países por estatísticas atuais por anos


Comentários: