29
/pt/
pt
AIzaSyAYiBZKx7MnpbEhh9jyipgxe19OcubqV5w
April 1, 2024
46329
Low income
LIC
false
2
1
Military expenditure (% of GDP)
2016,2015,2014,2013,2012,2011,2010,2009,2008,2007,2006,2005,2004,2003,2002,2001,2000,1999,1998,1997,1996,1995,1994,1993,1992,1991,1990,1989
Download
Biblioteca de estatísticas globais →Low income →

Military expenditure (% of GDP)

Estas estatísticas em outros países:
AfghanistanAlbaniaAlgeriaAngolaArab WorldArgentinaArmeniaAustraliaAustriaAzerbaijanBahrainBangladeshBelarusBelgiumBelizeBeninBoliviaBosnia and HerzegovinaBotswanaBrazilBrunei DarussalamBulgariaBurkina FasoBurundiCabo VerdeCambodiaCameroonCanadaCaribbean small statesCentral African RepublicCentral Europe and the BalticsChadChileChinaColombiaCongo, Dem. Rep.Congo, Rep.Costa RicaCote d'IvoireCroatiaCubaCyprusCzech RepublicDenmarkDjiboutiDominican RepublicEarly-demographic dividendEast Asia & PacificEast Asia & Pacific (excluding high income)East Asia & Pacific (IDA & IBRD countries)EcuadorEgypt, Arab Rep.El SalvadorEquatorial GuineaEritreaEstoniaEthiopiaEuro areaEurope & Central AsiaEurope & Central Asia (excluding high income)Europe & Central Asia (IDA & IBRD countries)European UnionFijiFinlandFragile and conflict affected situationsFranceGabonGambia, TheGeorgiaGermanyGhanaGreeceGuatemalaGuineaGuinea-BissauGuyanaHaitiHeavily indebted poor countries (HIPC)High incomeHondurasHungaryIBRD onlyIcelandIDA & IBRD totalIDA blendIDA onlyIDA totalIndiaIndonesiaIran, Islamic Rep.IraqIrelandIsraelItalyJamaicaJapanJordanKazakhstanKenyaKorea, Rep.KosovoKuwaitKyrgyz RepublicLao PDRLate-demographic dividendLatin America & Caribbean Latin America & Caribbean (excluding high income)Latin America & the Caribbean (IDA & IBRD countries)LatviaLeast developed countries: UN classificationLebanonLesothoLiberiaLibyaLithuaniaLow & middle incomeLow incomeLower middle incomeLuxembourgMacedonia, FYRMadagascarMalawiMalaysiaMaliMaltaMauritaniaMauritiusMexicoMiddle East & North AfricaMiddle East & North Africa (excluding high income)Middle East & North Africa (IDA & IBRD countries)Middle incomeMoldovaMongoliaMontenegroMoroccoMozambiqueMyanmarNamibiaNepalNetherlandsNew ZealandNicaraguaNigerNigeriaNorth AmericaNorwayOECD membersOmanOther small statesPakistanPanamaPapua New GuineaParaguayPeruPhilippinesPolandPortugalPost-demographic dividendPre-demographic dividendQatarRomaniaRussian FederationRwandaSaudi ArabiaSenegalSerbiaSeychellesSierra LeoneSingaporeSlovak RepublicSloveniaSmall statesSomaliaSouth AfricaSouth AsiaSouth Asia (IDA & IBRD)South SudanSpainSri LankaSub-Saharan Africa Sub-Saharan Africa (excluding high income)Sub-Saharan Africa (IDA & IBRD countries)SudanSwazilandSwedenSwitzerlandSyrian Arab RepublicTajikistanTanzaniaThailandTimor-LesteTogoTrinidad and TobagoTunisiaTurkeyTurkmenistanUgandaUkraineUnited Arab EmiratesUnited KingdomUnited StatesUpper middle incomeUruguayUzbekistanVenezuela, RBVietnamWorldYemen, Rep.ZambiaZimbabwe
Linha do tempo:
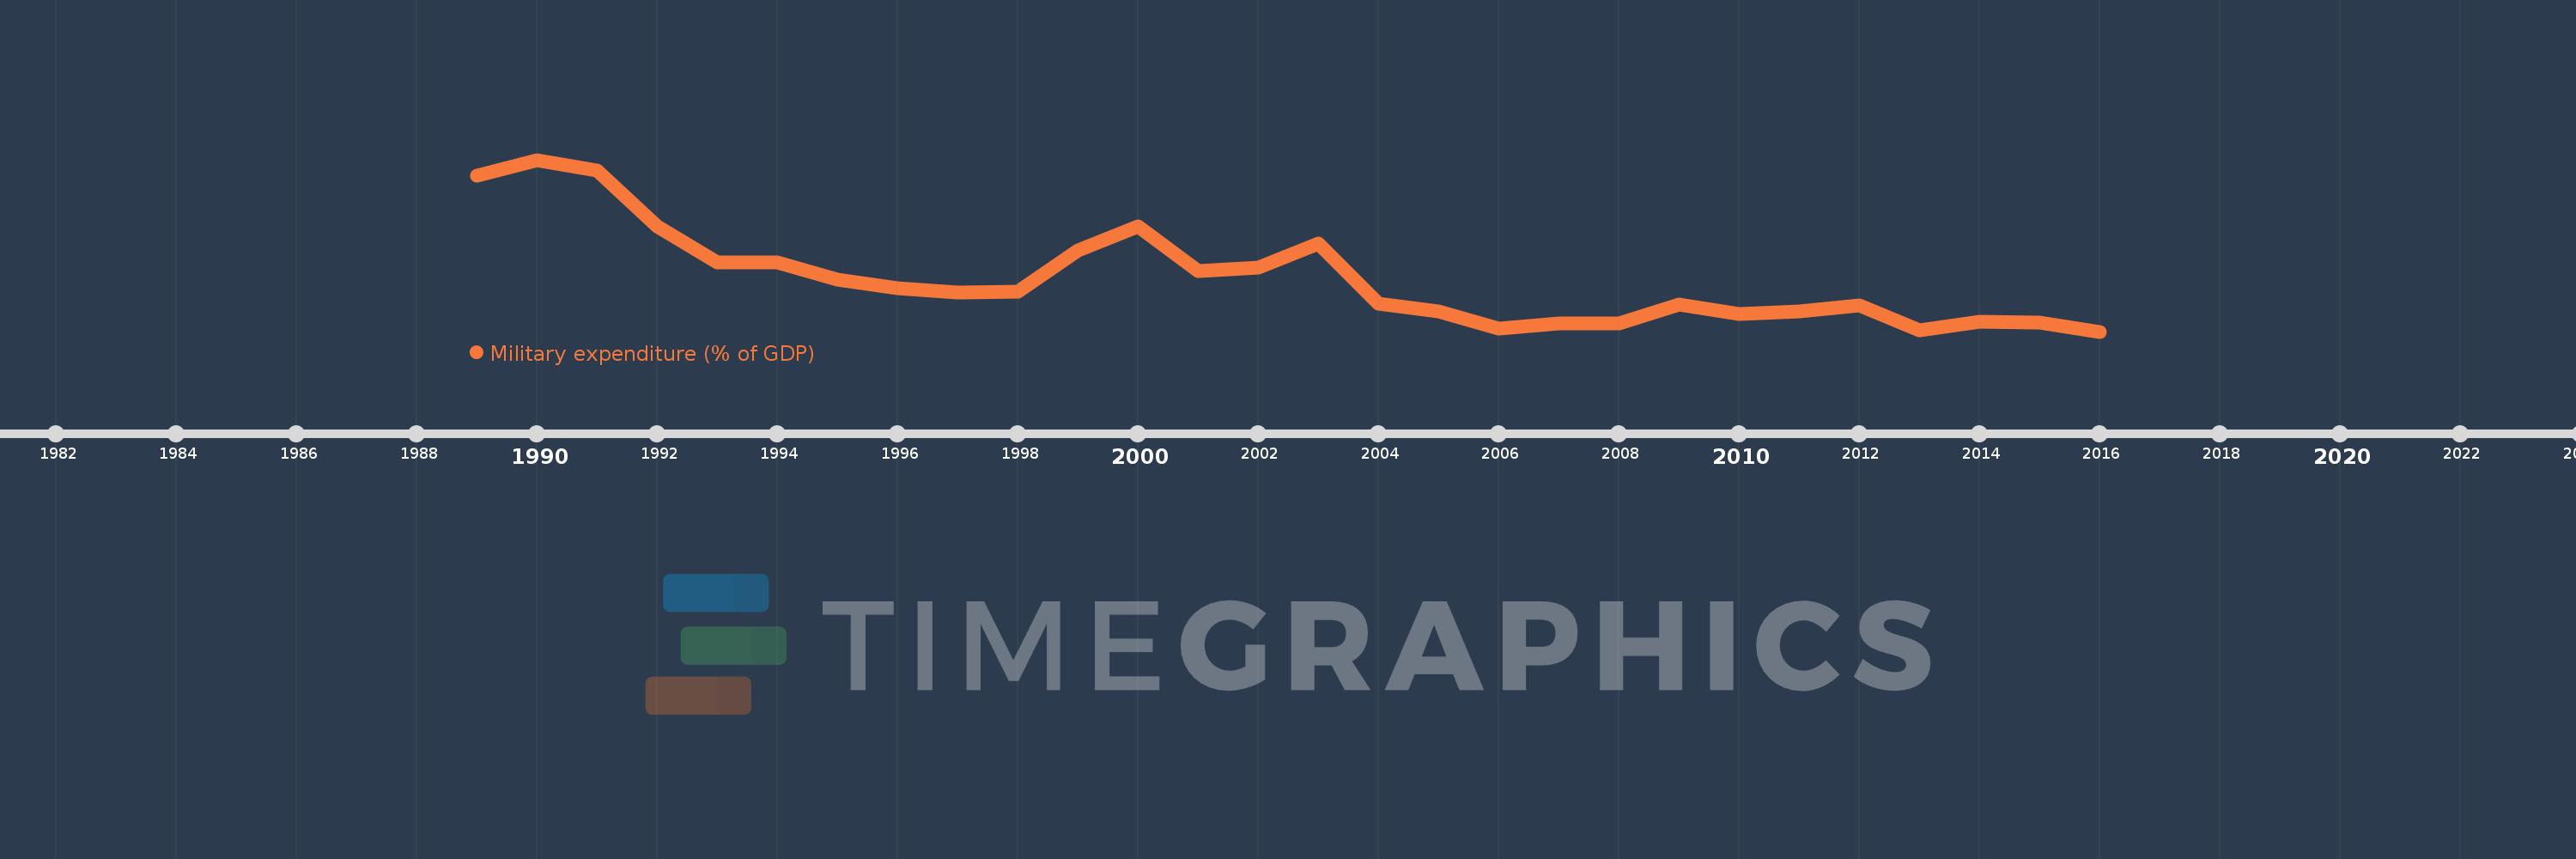
Nesta escala de tempo está apresentado um gráfico de 1989 ano até 2016 ano Low income. Dados de 1988 ano ausente. O número de observações reais por data: 28.
Fonte (nome):
Indicadores de desenvolvimento mundial
Fonte (organização):
Stockholm International Peace Research Institute (SIPRI), Yearbook: Armaments, Disarmament and International Security.
Categorias:
Public Sector
Foi atualizado:
23 abr 2017 ano
Indicadores de alterações dos valores ao longo dos anos
Em média:
2.106
Mínimo:
1.447
1 jan 2016 ano
Máximo:
3.584
1 jan 1990 ano
Na data de observação
Valor
Mudança absoluta
A alteração em relação ao valor anterior
1 jan 1989 ano
3.387
+3.387
0.0%
1 jan 1990 ano
3.584
+0.197
5.83%
1 jan 1991 ano
3.448
-0.136
-3.79%
1 jan 1992 ano
2.754
-0.694
-20.12%
1 jan 1993 ano
2.309
-0.446
-16.19%
1 jan 1994 ano
2.306
-0.002
-0.1%
1 jan 1995 ano
2.089
-0.217
-9.42%
1 jan 1996 ano
1.99
-0.099
-4.72%
1 jan 1997 ano
1.937
-0.054
-2.7%
1 jan 1998 ano
1.947
+0.011
0.55%
1 jan 1999 ano
2.459
+0.512
26.28%
1 jan 2000 ano
2.755
+0.296
12.03%
1 jan 2001 ano
2.201
-0.554
-20.1%
1 jan 2002 ano
2.242
+0.041
1.85%
1 jan 2003 ano
2.547
+0.305
13.6%
1 jan 2004 ano
1.79
-0.756
-29.69%
1 jan 2005 ano
1.697
-0.094
-5.24%
1 jan 2006 ano
1.486
-0.21
-12.39%
1 jan 2007 ano
1.545
+0.059
3.96%
1 jan 2008 ano
1.547
+0.002
0.14%
1 jan 2009 ano
1.783
+0.235
15.2%
1 jan 2010 ano
1.67
-0.113
-6.32%
1 jan 2011 ano
1.699
+0.029
1.75%
1 jan 2012 ano
1.771
+0.072
4.22%
1 jan 2013 ano
1.458
-0.313
-17.66%
1 jan 2014 ano
1.571
+0.113
7.75%
1 jan 2015 ano
1.558
-0.013
-0.81%
1 jan 2016 ano
1.447
-0.111
-7.15%
Classificação de países por estatísticas atuais por anos

Comentários:

Enviar
PremiumAbout & FeedbackAcordoPrivacidade
logo
© 2022 Selected Technologies LLC – Morgan Hill, California