29
/pt/
pt
AIzaSyAYiBZKx7MnpbEhh9jyipgxe19OcubqV5w
April 1, 2024
43755
Latin America & the Caribbean (IDA & IBRD countries)
TLA
false
2
1
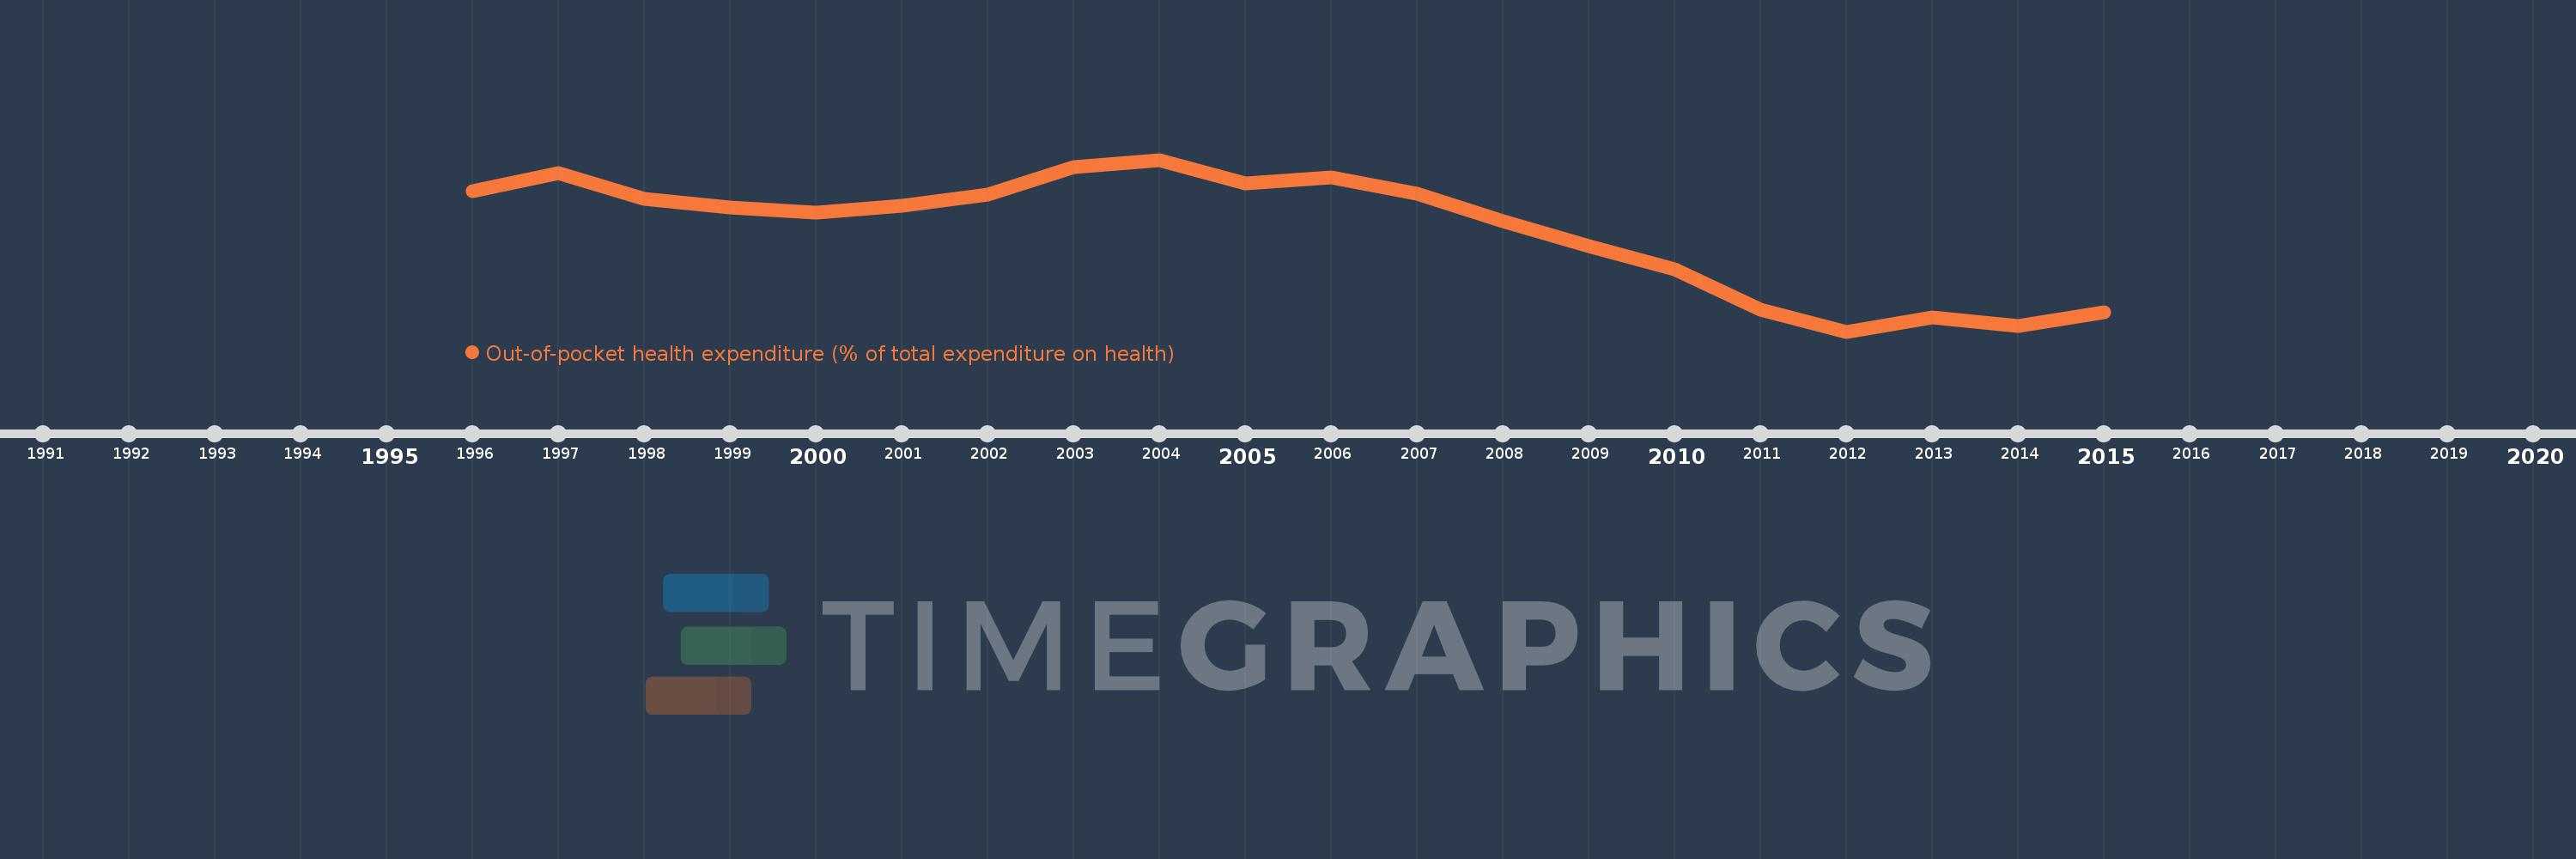
Out-of-pocket health expenditure (% of total expenditure on health)
2015,2014,2013,2012,2011,2010,2009,2008,2007,2006,2005,2004,2003,2002,2001,2000,1999,1998,1997,1996
Estas estatísticas em outros países:
AfghanistanAlbaniaAlgeriaAndorraAngolaAntigua and BarbudaArab WorldArgentinaArmeniaAustraliaAustriaAzerbaijanBahamas, TheBahrainBangladeshBarbadosBelarusBelgiumBelizeBeninBhutanBoliviaBosnia and HerzegovinaBotswanaBrazilBrunei DarussalamBulgariaBurkina FasoBurundiCabo VerdeCambodiaCameroonCanadaCaribbean small statesCentral African RepublicCentral Europe and the BalticsChadChileChinaColombiaComorosCongo, Dem. Rep.Congo, Rep.Costa RicaCote d'IvoireCroatiaCubaCyprusCzech RepublicDenmarkDjiboutiDominicaDominican RepublicEarly-demographic dividendEast Asia & PacificEast Asia & Pacific (excluding high income)East Asia & Pacific (IDA & IBRD countries)EcuadorEgypt, Arab Rep.El SalvadorEquatorial GuineaEritreaEstoniaEthiopiaEuro areaEurope & Central AsiaEurope & Central Asia (excluding high income)Europe & Central Asia (IDA & IBRD countries)European UnionFijiFinlandFragile and conflict affected situationsFranceGabonGambia, TheGeorgiaGermanyGhanaGreeceGrenadaGuatemalaGuineaGuinea-BissauGuyanaHaitiHeavily indebted poor countries (HIPC)High incomeHondurasHungaryIBRD onlyIcelandIDA & IBRD totalIDA blendIDA onlyIDA totalIndiaIndonesiaIran, Islamic Rep.IraqIrelandIsraelItalyJamaicaJapanJordanKazakhstanKenyaKiribatiKorea, Rep.KuwaitKyrgyz RepublicLao PDRLate-demographic dividendLatin America & Caribbean Latin America & Caribbean (excluding high income)Latin America & the Caribbean (IDA & IBRD countries)LatviaLeast developed countries: UN classificationLebanonLesothoLiberiaLibyaLithuaniaLow & middle incomeLow incomeLower middle incomeLuxembourgMacedonia, FYRMadagascarMalawiMalaysiaMaldivesMaliMaltaMarshall IslandsMauritaniaMauritiusMexicoMicronesia, Fed. Sts.Middle East & North AfricaMiddle East & North Africa (excluding high income)Middle East & North Africa (IDA & IBRD countries)Middle incomeMoldovaMonacoMongoliaMontenegroMoroccoMozambiqueMyanmarNamibiaNauruNepalNetherlandsNew ZealandNicaraguaNigerNigeriaNorth AmericaNorwayOECD membersOmanOther small statesPacific island small statesPakistanPalauPanamaPapua New GuineaParaguayPeruPhilippinesPolandPortugalPost-demographic dividendPre-demographic dividendQatarRomaniaRussian FederationRwandaSamoaSan MarinoSao Tome and PrincipeSaudi ArabiaSenegalSerbiaSeychellesSierra LeoneSingaporeSlovak RepublicSloveniaSmall statesSolomon IslandsSouth AfricaSouth AsiaSouth Asia (IDA & IBRD)South SudanSpainSri LankaSt. Kitts and NevisSt. LuciaSt. Vincent and the GrenadinesSub-Saharan Africa Sub-Saharan Africa (excluding high income)Sub-Saharan Africa (IDA & IBRD countries)SudanSurinameSwazilandSwedenSwitzerlandSyrian Arab RepublicTajikistanTanzaniaThailandTimor-LesteTogoTongaTrinidad and TobagoTunisiaTurkeyTurkmenistanTuvaluUgandaUkraineUnited Arab EmiratesUnited KingdomUnited StatesUpper middle incomeUruguayUzbekistanVanuatuVenezuela, RBVietnamWorldYemen, Rep.ZambiaZimbabwe Linha do tempo:
Nesta escala de tempo está apresentado um gráfico de 1996 ano até 2015 ano Latin America & the Caribbean (IDA & IBRD countries). Dados de 1995 ano ausente. O número de observações reais por data: 20.
Fonte (nome):
Indicadores de desenvolvimento mundial
Fonte (organização):
World Health Organization Global Health Expenditure database (see http://apps.who.int/nha/database for the most recent updates).
Categorias:
Health
Foi atualizado:
23 abr 2017 ano
Indicadores de alterações dos valores ao longo dos anos
Mínimo:
31.11
1 jan 2012 ano
Máximo:
41.912
1 jan 2004 ano
Na data de observação
Valor
Mudança absoluta
A alteração em relação ao valor anterior
1 jan 1996 ano
39.956
+39.956
0.0%
1 jan 1997 ano
41.101
+1.145
2.86%
1 jan 1998 ano
39.48
-1.62
-3.94%
1 jan 1999 ano
38.932
-0.549
-1.39%
1 jan 2000 ano
38.594
-0.337
-0.87%
1 jan 2001 ano
39.021
+0.427
1.11%
1 jan 2002 ano
39.741
+0.719
1.84%
1 jan 2003 ano
41.466
+1.725
4.34%
1 jan 2004 ano
41.912
+0.446
1.07%
1 jan 2005 ano
40.443
-1.468
-3.5%
1 jan 2006 ano
40.807
+0.364
0.9%
1 jan 2007 ano
39.765
-1.042
-2.55%
1 jan 2008 ano
38.075
-1.69
-4.25%
1 jan 2009 ano
36.487
-1.588
-4.17%
1 jan 2010 ano
35.039
-1.448
-3.97%
1 jan 2011 ano
32.477
-2.563
-7.31%
1 jan 2012 ano
31.11
-1.367
-4.21%
1 jan 2013 ano
31.98
+0.87
2.8%
1 jan 2014 ano
31.484
-0.496
-1.55%
1 jan 2015 ano
32.303
+0.818
2.6%
Classificação de países por estatísticas atuais por anos


Comentários: