29
/pt/
pt
AIzaSyAYiBZKx7MnpbEhh9jyipgxe19OcubqV5w
April 1, 2024
43513
Latin America & the Caribbean (IDA & IBRD countries)
TLA
false
2
1
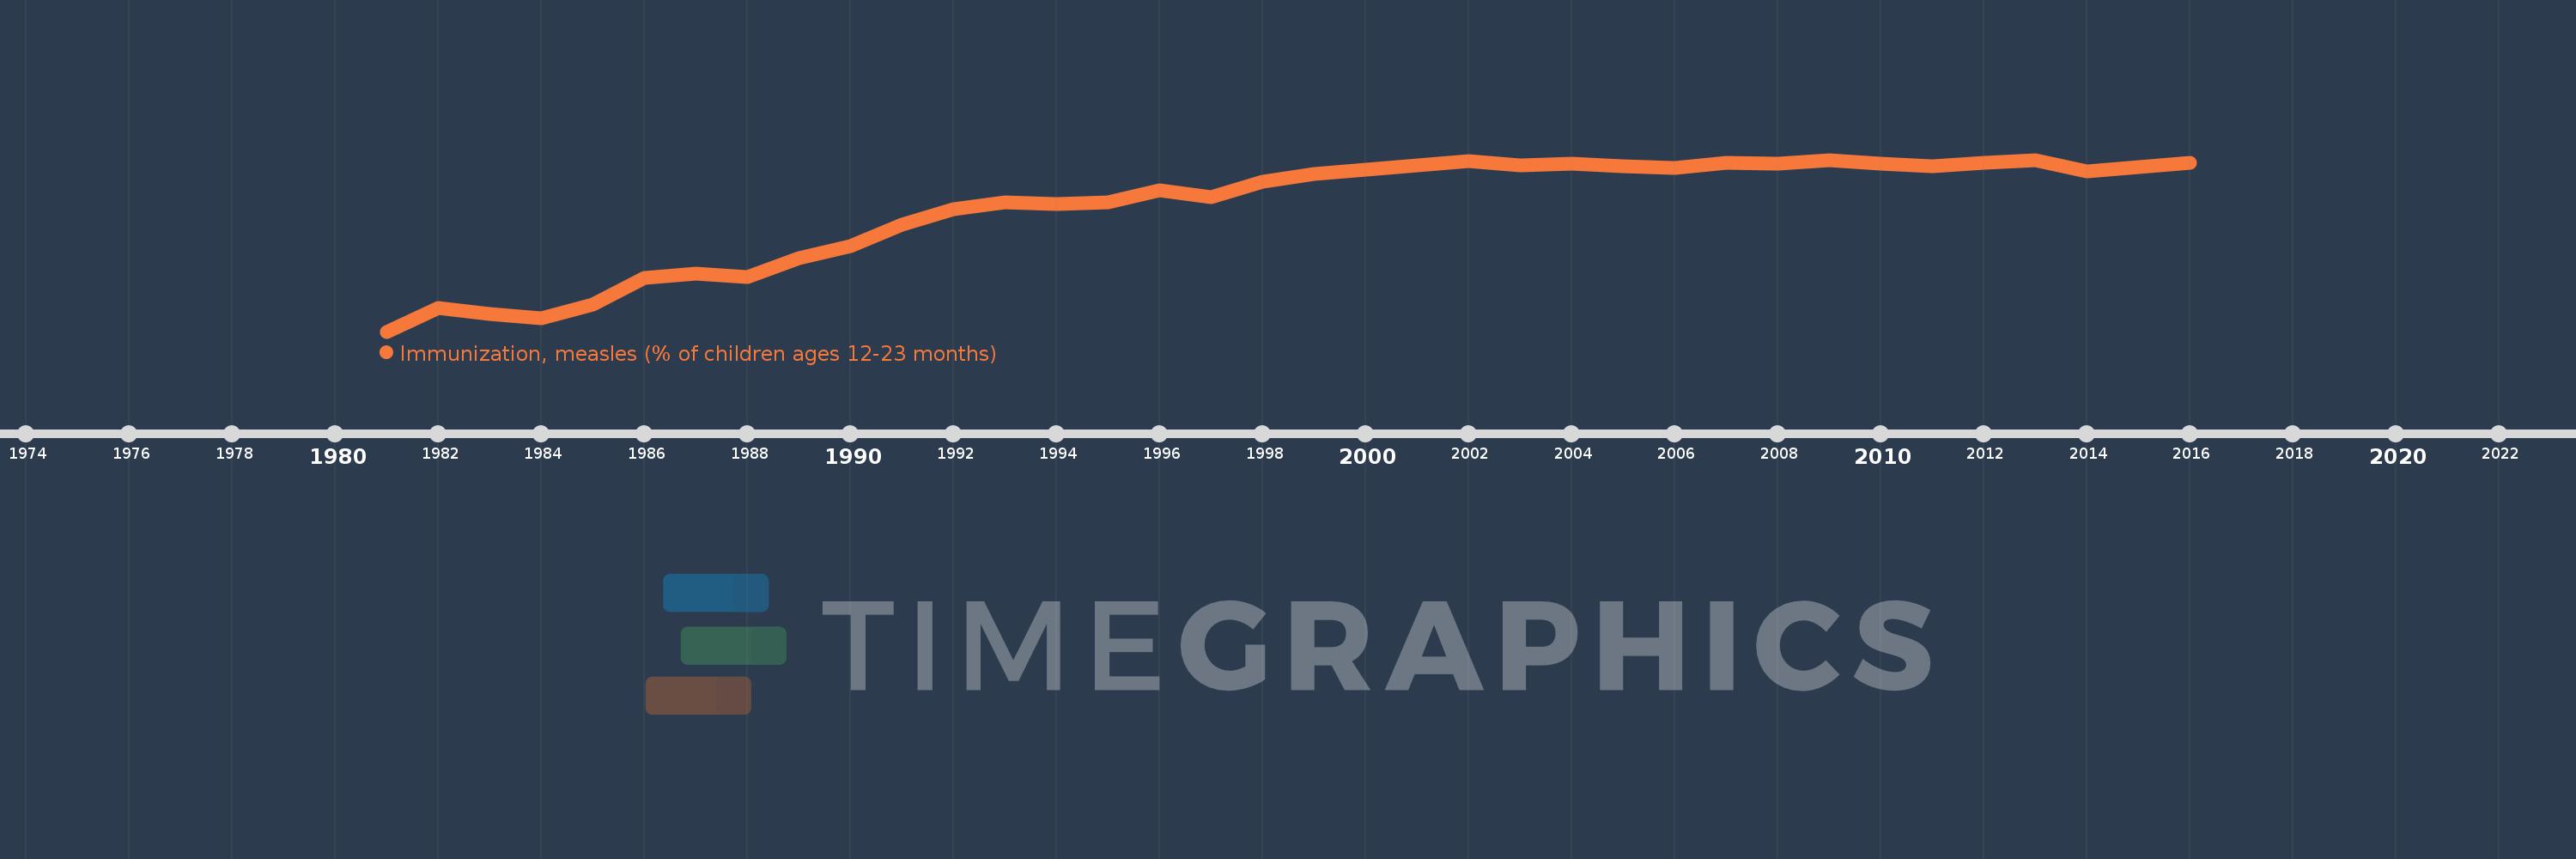
Immunization, measles (% of children ages 12-23 months)
2016,2015,2014,2013,2012,2011,2010,2009,2008,2007,2006,2005,2004,2003,2002,2001,2000,1999,1998,1997,1996,1995,1994,1993,1992,1991,1990,1989,1988,1987,1986,1985,1984,1983,1982,1981
Estas estatísticas em outros países:
AfghanistanAlbaniaAlgeriaAndorraAngolaAntigua and BarbudaArab WorldArgentinaArmeniaAustraliaAustriaAzerbaijanBahamas, TheBahrainBangladeshBarbadosBelarusBelgiumBelizeBeninBhutanBoliviaBosnia and HerzegovinaBotswanaBrazilBrunei DarussalamBulgariaBurkina FasoBurundiCabo VerdeCambodiaCameroonCanadaCaribbean small statesCentral African RepublicCentral Europe and the BalticsChadChileChinaColombiaComorosCongo, Dem. Rep.Congo, Rep.Costa RicaCote d'IvoireCroatiaCubaCyprusCzech RepublicDenmarkDjiboutiDominicaDominican RepublicEarly-demographic dividendEast Asia & PacificEast Asia & Pacific (excluding high income)East Asia & Pacific (IDA & IBRD countries)EcuadorEgypt, Arab Rep.El SalvadorEquatorial GuineaEritreaEstoniaEthiopiaEuro areaEurope & Central AsiaEurope & Central Asia (excluding high income)Europe & Central Asia (IDA & IBRD countries)European UnionFijiFinlandFragile and conflict affected situationsFranceGabonGambia, TheGeorgiaGermanyGhanaGreeceGrenadaGuatemalaGuineaGuinea-BissauGuyanaHaitiHeavily indebted poor countries (HIPC)High incomeHondurasHungaryIBRD onlyIcelandIDA & IBRD totalIDA blendIDA onlyIDA totalIndiaIndonesiaIran, Islamic Rep.IraqIrelandIsraelItalyJamaicaJapanJordanKazakhstanKenyaKiribatiKorea, Dem. People’s Rep.Korea, Rep.KuwaitKyrgyz RepublicLao PDRLate-demographic dividendLatin America & Caribbean Latin America & Caribbean (excluding high income)Latin America & the Caribbean (IDA & IBRD countries)LatviaLeast developed countries: UN classificationLebanonLesothoLiberiaLibyaLithuaniaLow & middle incomeLow incomeLower middle incomeLuxembourgMacedonia, FYRMadagascarMalawiMalaysiaMaldivesMaliMaltaMarshall IslandsMauritaniaMauritiusMexicoMicronesia, Fed. Sts.Middle East & North AfricaMiddle East & North Africa (excluding high income)Middle East & North Africa (IDA & IBRD countries)Middle incomeMoldovaMonacoMongoliaMontenegroMoroccoMozambiqueMyanmarNamibiaNauruNepalNetherlandsNew ZealandNicaraguaNigerNigeriaNorth AmericaNorwayOECD membersOmanOther small statesPacific island small statesPakistanPalauPanamaPapua New GuineaParaguayPeruPhilippinesPolandPortugalPost-demographic dividendPre-demographic dividendQatarRomaniaRussian FederationRwandaSamoaSan MarinoSao Tome and PrincipeSaudi ArabiaSenegalSerbiaSeychellesSierra LeoneSingaporeSlovak RepublicSloveniaSmall statesSolomon IslandsSomaliaSouth AfricaSouth AsiaSouth Asia (IDA & IBRD)South SudanSpainSri LankaSt. Kitts and NevisSt. LuciaSt. Vincent and the GrenadinesSub-Saharan Africa Sub-Saharan Africa (excluding high income)Sub-Saharan Africa (IDA & IBRD countries)SudanSurinameSwazilandSwedenSwitzerlandSyrian Arab RepublicTajikistanTanzaniaThailandTimor-LesteTogoTongaTrinidad and TobagoTunisiaTurkeyTurkmenistanTuvaluUgandaUkraineUnited Arab EmiratesUnited KingdomUnited StatesUpper middle incomeUruguayUzbekistanVanuatuVenezuela, RBVietnamWorldYemen, Rep.ZambiaZimbabwe Linha do tempo:
Nesta escala de tempo está apresentado um gráfico de 1981 ano até 2016 ano Latin America & the Caribbean (IDA & IBRD countries). Dados de 1980 ano ausente. O número de observações reais por data: 36.
Fonte (nome):
Indicadores de desenvolvimento mundial
Fonte (organização):
WHO and UNICEF (http://www.who.int/immunization/monitoring_surveillance/en/).
Categorias:
Health
Foi atualizado:
23 abr 2017 ano
Indicadores de alterações dos valores ao longo dos anos
Mínimo:
43.128
1 jan 1981 ano
Máximo:
95.266
1 jan 2013 ano
Na data de observação
Valor
Mudança absoluta
A alteração em relação ao valor anterior
1 jan 1981 ano
43.128
+43.128
0.0%
1 jan 1982 ano
50.371
+7.243
16.79%
1 jan 1983 ano
48.482
-1.889
-3.75%
1 jan 1984 ano
47.095
-1.387
-2.86%
1 jan 1985 ano
51.354
+4.259
9.04%
1 jan 1986 ano
59.525
+8.172
15.91%
1 jan 1987 ano
60.691
+1.165
1.96%
1 jan 1988 ano
59.603
-1.088
-1.79%
1 jan 1989 ano
65.413
+5.811
9.75%
1 jan 1990 ano
69.108
+3.695
5.65%
1 jan 1991 ano
75.605
+6.496
9.4%
1 jan 1992 ano
80.247
+4.642
6.14%
1 jan 1993 ano
82.411
+2.164
2.7%
1 jan 1994 ano
81.799
-0.612
-0.74%
1 jan 1995 ano
82.354
+0.555
0.68%
1 jan 1996 ano
85.979
+3.625
4.4%
1 jan 1997 ano
83.997
-1.982
-2.3%
1 jan 1998 ano
88.526
+4.529
5.39%
1 jan 1999 ano
90.861
+2.335
2.64%
1 jan 2000 ano
92.181
+1.32
1.45%
1 jan 2001 ano
93.613
+1.432
1.55%
1 jan 2002 ano
94.781
+1.169
1.25%
1 jan 2003 ano
93.527
-1.254
-1.32%
1 jan 2004 ano
93.987
+0.46
0.49%
1 jan 2005 ano
93.259
-0.728
-0.77%
1 jan 2006 ano
92.915
-0.344
-0.37%
1 jan 2007 ano
94.481
+1.566
1.69%
1 jan 2008 ano
93.968
-0.513
-0.54%
1 jan 2009 ano
95.173
+1.206
1.28%
1 jan 2010 ano
94.089
-1.084
-1.14%
1 jan 2011 ano
93.381
-0.708
-0.75%
1 jan 2012 ano
94.409
+1.029
1.1%
1 jan 2013 ano
95.266
+0.856
0.91%
1 jan 2014 ano
91.846
-3.42
-3.59%
1 jan 2015 ano
93.028
+1.183
1.29%
1 jan 2016 ano
94.317
+1.289
1.39%
Classificação de países por estatísticas atuais por anos


Comentários: