29
/pt/
pt
AIzaSyAYiBZKx7MnpbEhh9jyipgxe19OcubqV5w
April 1, 2024
42245
Latin America & Caribbean (excluding high income)
LAC
false
2
1
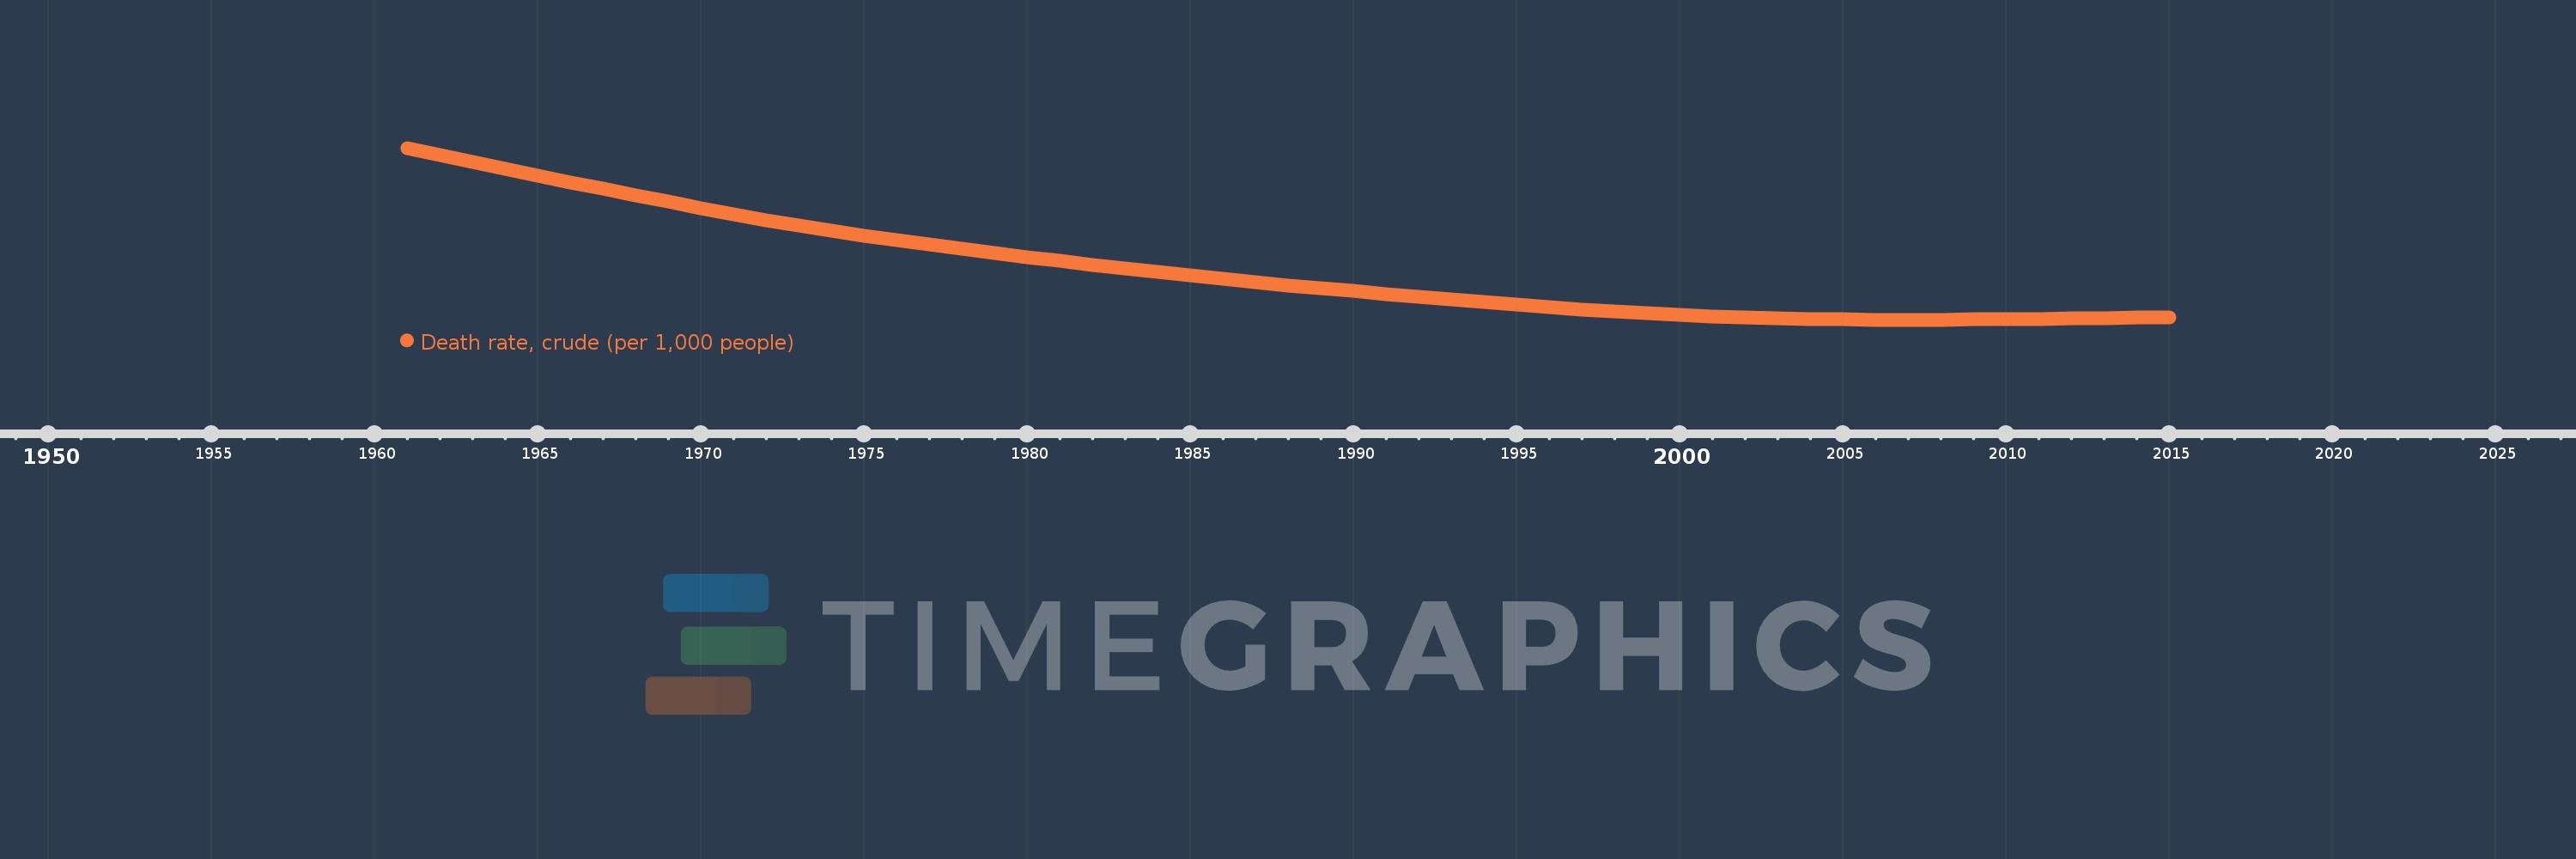
Death rate, crude (per 1,000 people)
2015,2014,2013,2012,2011,2010,2009,2008,2007,2006,2005,2004,2003,2002,2001,2000,1999,1998,1997,1996,1995,1994,1993,1992,1991,1990,1989,1988,1987,1986,1985,1984,1983,1982,1981,1980,1979,1978,1977,1976,1975,1974,1973,1972,1971,1970,1969,1968,1967,1966,1965,1964,1963,1962,1961
Estas estatísticas em outros países:
AfghanistanAlbaniaAlgeriaAmerican SamoaAndorraAngolaAntigua and BarbudaArab WorldArgentinaArmeniaArubaAustraliaAustriaAzerbaijanBahamas, TheBahrainBangladeshBarbadosBelarusBelgiumBelizeBeninBermudaBhutanBoliviaBosnia and HerzegovinaBotswanaBrazilBrunei DarussalamBulgariaBurkina FasoBurundiCabo VerdeCambodiaCameroonCanadaCaribbean small statesCayman IslandsCentral African RepublicCentral Europe and the BalticsChadChannel IslandsChileChinaColombiaComorosCongo, Dem. Rep.Congo, Rep.Costa RicaCote d'IvoireCroatiaCubaCuracaoCyprusCzech RepublicDenmarkDjiboutiDominicaDominican RepublicEarly-demographic dividendEast Asia & PacificEast Asia & Pacific (excluding high income)East Asia & Pacific (IDA & IBRD countries)EcuadorEgypt, Arab Rep.El SalvadorEquatorial GuineaEritreaEstoniaEthiopiaEuro areaEurope & Central AsiaEurope & Central Asia (excluding high income)Europe & Central Asia (IDA & IBRD countries)European UnionFaroe IslandsFijiFinlandFragile and conflict affected situationsFranceFrench PolynesiaGabonGambia, TheGeorgiaGermanyGhanaGreeceGreenlandGrenadaGuamGuatemalaGuineaGuinea-BissauGuyanaHaitiHeavily indebted poor countries (HIPC)High incomeHondurasHong Kong SAR, ChinaHungaryIBRD onlyIcelandIDA & IBRD totalIDA blendIDA onlyIDA totalIndiaIndonesiaIran, Islamic Rep.IraqIrelandIsle of ManIsraelItalyJamaicaJapanJordanKazakhstanKenyaKiribatiKorea, Dem. People’s Rep.Korea, Rep.KosovoKuwaitKyrgyz RepublicLao PDRLate-demographic dividendLatin America & Caribbean Latin America & Caribbean (excluding high income)Latin America & the Caribbean (IDA & IBRD countries)LatviaLeast developed countries: UN classificationLebanonLesothoLiberiaLibyaLiechtensteinLithuaniaLow & middle incomeLow incomeLower middle incomeLuxembourgMacao SAR, ChinaMacedonia, FYRMadagascarMalawiMalaysiaMaldivesMaliMaltaMarshall IslandsMauritaniaMauritiusMexicoMicronesia, Fed. Sts.Middle East & North AfricaMiddle East & North Africa (excluding high income)Middle East & North Africa (IDA & IBRD countries)Middle incomeMoldovaMonacoMongoliaMontenegroMoroccoMozambiqueMyanmarNamibiaNepalNetherlandsNew CaledoniaNew ZealandNicaraguaNigerNigeriaNorth AmericaNorwayOECD membersOmanOther small statesPacific island small statesPakistanPalauPanamaPapua New GuineaParaguayPeruPhilippinesPolandPortugalPost-demographic dividendPre-demographic dividendPuerto RicoQatarRomaniaRussian FederationRwandaSamoaSan MarinoSao Tome and PrincipeSaudi ArabiaSenegalSerbiaSeychellesSierra LeoneSingaporeSint Maarten (Dutch part)Slovak RepublicSloveniaSmall statesSolomon IslandsSomaliaSouth AfricaSouth AsiaSouth Asia (IDA & IBRD)South SudanSpainSri LankaSt. Kitts and NevisSt. LuciaSt. Martin (French part)St. Vincent and the GrenadinesSub-Saharan Africa Sub-Saharan Africa (excluding high income)Sub-Saharan Africa (IDA & IBRD countries)SudanSurinameSwazilandSwedenSwitzerlandSyrian Arab RepublicTajikistanTanzaniaThailandTimor-LesteTogoTongaTrinidad and TobagoTunisiaTurkeyTurkmenistanUgandaUkraineUnited Arab EmiratesUnited KingdomUnited StatesUpper middle incomeUruguayUzbekistanVanuatuVenezuela, RBVietnamVirgin Islands (U.S.)West Bank and GazaWorldYemen, Rep.ZambiaZimbabwe Linha do tempo:
Nesta escala de tempo está apresentado um gráfico de 1961 ano até 2015 ano Latin America & Caribbean (excluding high income). Dados de 1960 ano ausente. O número de observações reais por data: 55.
Fonte (nome):
Indicadores de desenvolvimento mundial
Fonte (organização):
(1) United Nations Population Division. World Population Prospects, (2) Census reports and other statistical publications from national statistical offices, (3) Eurostat: Demographic Statistics, (4) United Nations Statistical Division. Population and Vital Statistics Reprot (various years), (5) U.S. Census Bureau: International Database, and (6) Secretariat of the Pacific Community: Statistics and Demography Programme.
Categorias:
Health
Foi atualizado:
23 abr 2017 ano
Indicadores de alterações dos valores ao longo dos anos
Mínimo:
5.766
1 jan 2007 ano
Máximo:
13.172
1 jan 1961 ano
Na data de observação
Valor
Mudança absoluta
A alteração em relação ao valor anterior
1 jan 1961 ano
13.172
+13.172
0.0%
1 jan 1962 ano
12.863
-0.309
-2.35%
1 jan 1963 ano
12.562
-0.301
-2.34%
1 jan 1964 ano
12.268
-0.294
-2.34%
1 jan 1965 ano
11.979
-0.289
-2.36%
1 jan 1966 ano
11.693
-0.286
-2.39%
1 jan 1967 ano
11.409
-0.284
-2.43%
1 jan 1968 ano
11.128
-0.281
-2.46%
1 jan 1969 ano
10.85
-0.277
-2.49%
1 jan 1970 ano
10.579
-0.272
-2.5%
1 jan 1971 ano
10.315
-0.264
-2.49%
1 jan 1972 ano
10.062
-0.253
-2.45%
1 jan 1973 ano
9.822
-0.24
-2.38%
1 jan 1974 ano
9.597
-0.226
-2.3%
1 jan 1975 ano
9.386
-0.211
-2.2%
1 jan 1976 ano
9.187
-0.199
-2.12%
1 jan 1977 ano
8.998
-0.189
-2.06%
1 jan 1978 ano
8.818
-0.18
-2.01%
1 jan 1979 ano
8.641
-0.176
-2.0%
1 jan 1980 ano
8.469
-0.172
-1.99%
1 jan 1981 ano
8.3
-0.169
-2.0%
1 jan 1982 ano
8.134
-0.166
-2.0%
1 jan 1983 ano
7.972
-0.161
-1.98%
1 jan 1984 ano
7.816
-0.157
-1.96%
1 jan 1985 ano
7.664
-0.151
-1.93%
1 jan 1986 ano
7.52
-0.145
-1.89%
1 jan 1987 ano
7.38
-0.139
-1.85%
1 jan 1988 ano
7.247
-0.133
-1.81%
1 jan 1989 ano
7.12
-0.127
-1.75%
1 jan 1990 ano
6.998
-0.122
-1.71%
1 jan 1991 ano
6.873
-0.125
-1.79%
1 jan 1992 ano
6.755
-0.118
-1.72%
1 jan 1993 ano
6.639
-0.115
-1.71%
1 jan 1994 ano
6.528
-0.112
-1.68%
1 jan 1995 ano
6.416
-0.111
-1.71%
1 jan 1996 ano
6.313
-0.103
-1.61%
1 jan 1997 ano
6.215
-0.098
-1.55%
1 jan 1998 ano
6.118
-0.097
-1.56%
1 jan 1999 ano
6.038
-0.08
-1.31%
1 jan 2000 ano
5.969
-0.069
-1.14%
1 jan 2001 ano
5.907
-0.062
-1.04%
1 jan 2002 ano
5.86
-0.047
-0.79%
1 jan 2003 ano
5.824
-0.036
-0.62%
1 jan 2004 ano
5.798
-0.026
-0.45%
1 jan 2005 ano
5.778
-0.02
-0.35%
1 jan 2006 ano
5.768
-0.01
-0.17%
1 jan 2007 ano
5.766
-0.001
-0.02%
1 jan 2008 ano
5.77
+0.004
0.07%
1 jan 2009 ano
5.776
+0.006
0.1%
1 jan 2010 ano
5.786
+0.009
0.16%
1 jan 2011 ano
5.805
+0.02
0.34%
1 jan 2012 ano
5.815
+0.01
0.16%
1 jan 2013 ano
5.835
+0.02
0.35%
1 jan 2014 ano
5.855
+0.02
0.34%
1 jan 2015 ano
5.88
+0.024
0.42%
Classificação de países por estatísticas atuais por anos


Comentários: