29
/pt/
pt
AIzaSyAYiBZKx7MnpbEhh9jyipgxe19OcubqV5w
April 1, 2024
37273
IDA & IBRD total
IBT
false
2
1
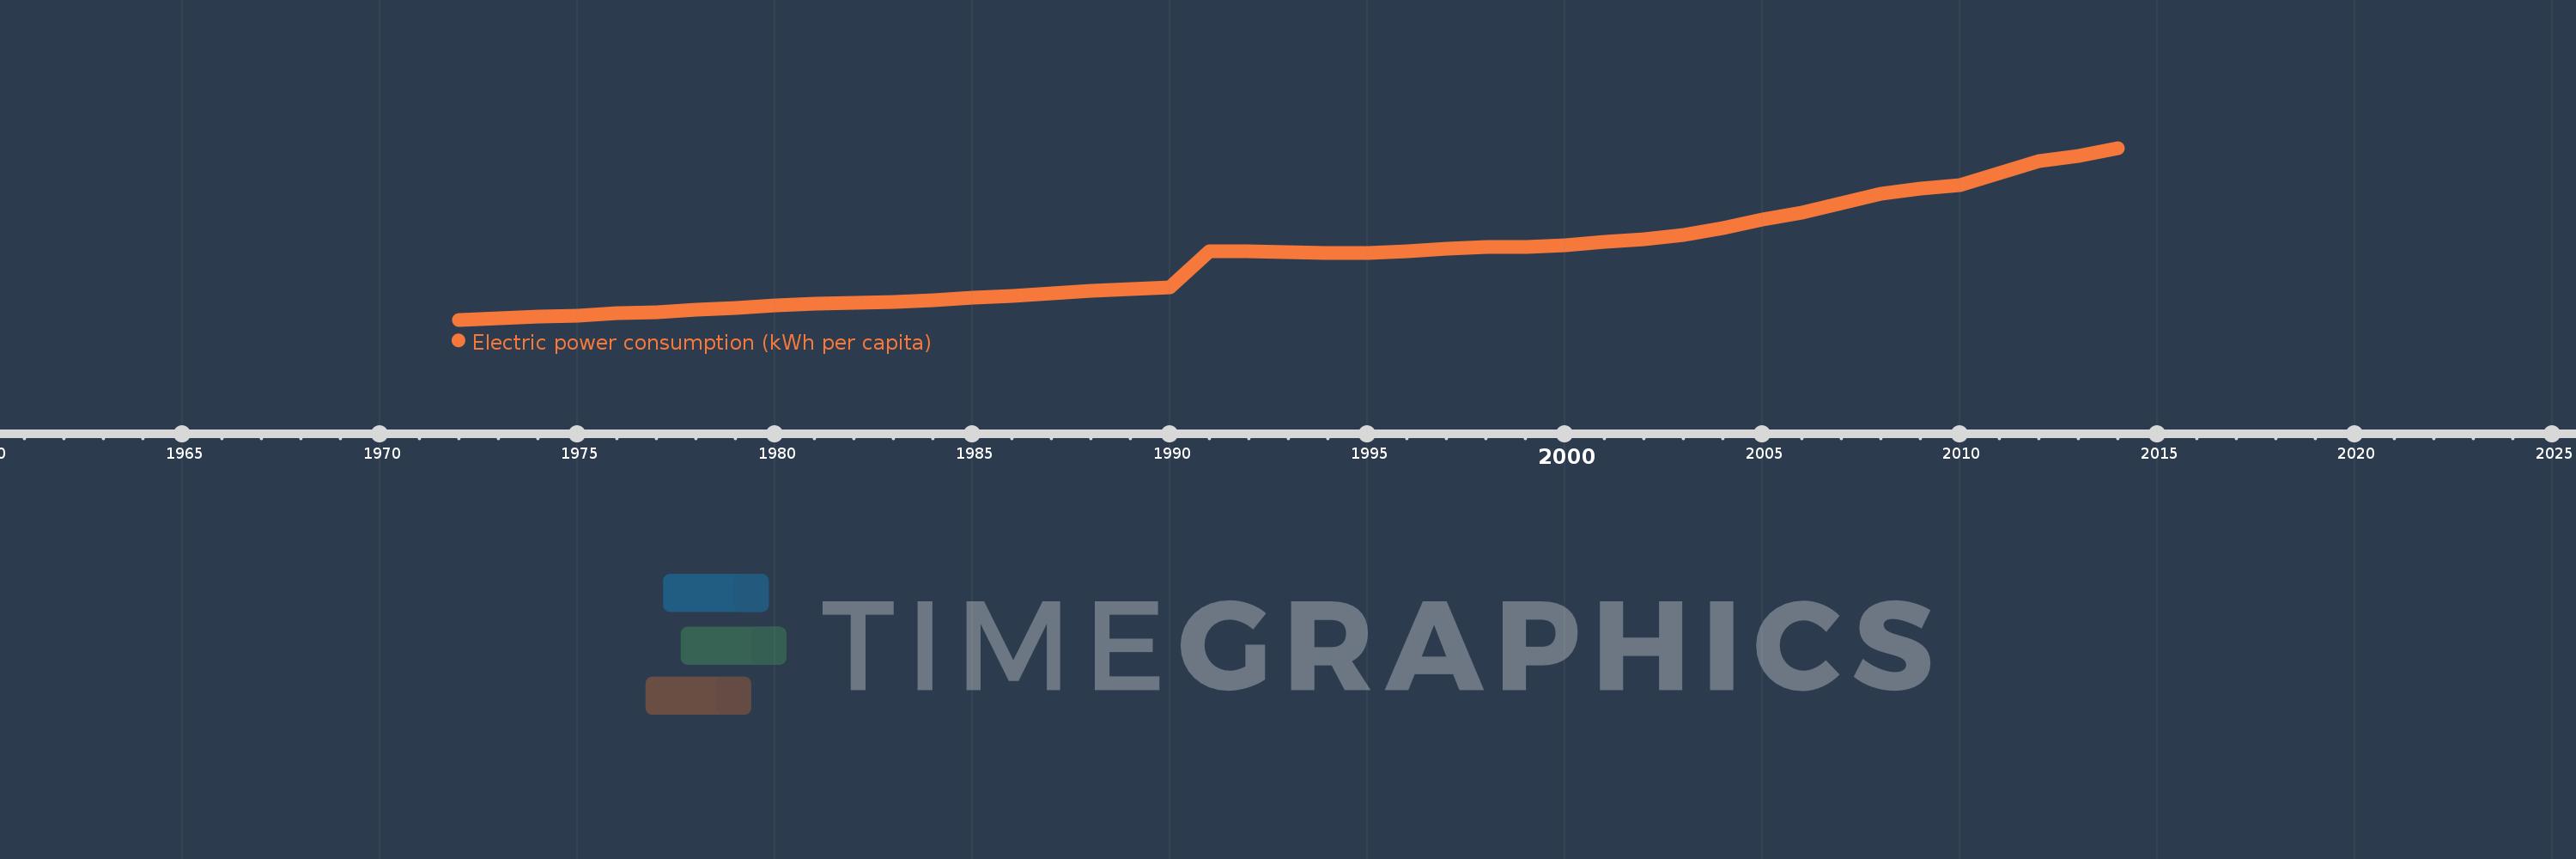
Electric power consumption (kWh per capita)
2014,2013,2012,2011,2010,2009,2008,2007,2006,2005,2004,2003,2002,2001,2000,1999,1998,1997,1996,1995,1994,1993,1992,1991,1990,1989,1988,1987,1986,1985,1984,1983,1982,1981,1980,1979,1978,1977,1976,1975,1974,1973,1972
Estas estatísticas em outros países:
AlbaniaAlgeriaAngolaArab WorldArgentinaArmeniaAustraliaAustriaAzerbaijanBahrainBangladeshBelarusBelgiumBeninBoliviaBosnia and HerzegovinaBotswanaBrazilBrunei DarussalamBulgariaCambodiaCameroonCanadaCentral Europe and the BalticsChileChinaColombiaCongo, Dem. Rep.Congo, Rep.Costa RicaCote d'IvoireCroatiaCubaCuracaoCyprusCzech RepublicDenmarkDominican RepublicEarly-demographic dividendEast Asia & PacificEast Asia & Pacific (excluding high income)East Asia & Pacific (IDA & IBRD countries)EcuadorEgypt, Arab Rep.El SalvadorEritreaEstoniaEthiopiaEuro areaEurope & Central AsiaEurope & Central Asia (excluding high income)Europe & Central Asia (IDA & IBRD countries)European UnionFinlandFragile and conflict affected situationsFranceGabonGeorgiaGermanyGhanaGibraltarGreeceGuatemalaHaitiHeavily indebted poor countries (HIPC)High incomeHondurasHong Kong SAR, ChinaHungaryIBRD onlyIcelandIDA & IBRD totalIDA blendIDA onlyIDA totalIndiaIndonesiaIran, Islamic Rep.IraqIrelandIsraelItalyJamaicaJapanJordanKazakhstanKenyaKorea, Dem. People’s Rep.Korea, Rep.KosovoKuwaitKyrgyz RepublicLate-demographic dividendLatin America & Caribbean Latin America & Caribbean (excluding high income)Latin America & the Caribbean (IDA & IBRD countries)LatviaLeast developed countries: UN classificationLebanonLibyaLithuaniaLow & middle incomeLower middle incomeLuxembourgMacedonia, FYRMalaysiaMaltaMauritiusMexicoMiddle East & North AfricaMiddle East & North Africa (excluding high income)Middle East & North Africa (IDA & IBRD countries)Middle incomeMoldovaMongoliaMontenegroMoroccoMozambiqueMyanmarNamibiaNepalNetherlandsNew ZealandNicaraguaNigerNigeriaNorth AmericaNorwayOECD membersOmanPakistanPanamaParaguayPeruPhilippinesPolandPortugalPost-demographic dividendPre-demographic dividendQatarRomaniaRussian FederationSaudi ArabiaSenegalSerbiaSingaporeSlovak RepublicSloveniaSouth AfricaSouth AsiaSouth Asia (IDA & IBRD)South SudanSpainSri LankaSub-Saharan Africa Sub-Saharan Africa (excluding high income)Sub-Saharan Africa (IDA & IBRD countries)SudanSwedenSwitzerlandSyrian Arab RepublicTajikistanTanzaniaThailandTogoTrinidad and TobagoTunisiaTurkeyTurkmenistanUkraineUnited Arab EmiratesUnited KingdomUnited StatesUpper middle incomeUruguayUzbekistanVenezuela, RBVietnamWorldYemen, Rep.ZambiaZimbabwe Linha do tempo:
Nesta escala de tempo está apresentado um gráfico de 1972 ano até 2014 ano IDA & IBRD total. Dados de 1971 ano ausente. O número de observações reais por data: 43.
Fonte (nome):
Indicadores de desenvolvimento mundial
Fonte (organização):
IEA Statistics © OECD/IEA 2014 (http://www.iea.org/stats/index.asp), subject to https://www.iea.org/t&c/termsandconditions/
Categorias:
Energy & Mining, Climate Change, Infrastructure
Foi atualizado:
23 abr 2017 ano
Indicadores de alterações dos valores ao longo dos anos
Mínimo:
224.268
1 jan 1972 ano
Máximo:
1.916 mil
1 jan 2014 ano
Na data de observação
Valor
Mudança absoluta
A alteração em relação ao valor anterior
1 jan 1972 ano
224.268
+224.268
0.0%
1 jan 1973 ano
239.471
+15.204
6.78%
1 jan 1974 ano
254.861
+15.389
6.43%
1 jan 1975 ano
264.776
+9.915
3.89%
1 jan 1976 ano
285.487
+20.711
7.82%
1 jan 1977 ano
301.935
+16.449
5.76%
1 jan 1978 ano
319.984
+18.048
5.98%
1 jan 1979 ano
342.127
+22.143
6.92%
1 jan 1980 ano
362.568
+20.441
5.97%
1 jan 1981 ano
380.62
+18.052
4.98%
1 jan 1982 ano
387.448
+6.828
1.79%
1 jan 1983 ano
400.823
+13.374
3.45%
1 jan 1984 ano
417.584
+16.761
4.18%
1 jan 1985 ano
440.494
+22.91
5.49%
1 jan 1986 ano
461.06
+20.566
4.67%
1 jan 1987 ano
484.583
+23.523
5.1%
1 jan 1988 ano
506.065
+21.482
4.43%
1 jan 1989 ano
530.318
+24.253
4.79%
1 jan 1990 ano
547.127
+16.809
3.17%
1 jan 1991 ano
897.512
+350.385
64.04%
1 jan 1992 ano
898.399
+0.887
0.1%
1 jan 1993 ano
887.8
-10.598
-1.18%
1 jan 1994 ano
883.568
-4.233
-0.48%
1 jan 1995 ano
883.162
-0.406
-0.05%
1 jan 1996 ano
900.82
+17.658
2.0%
1 jan 1997 ano
921.717
+20.897
2.32%
1 jan 1998 ano
937.114
+15.396
1.67%
1 jan 1999 ano
939.836
+2.722
0.29%
1 jan 2000 ano
956.342
+16.506
1.76%
1 jan 2001 ano
994.257
+37.915
3.96%
1 jan 2002 ano
1.017 mil
+22.592
2.27%
1 jan 2003 ano
1.059 mil
+42.313
4.16%
1 jan 2004 ano
1.129 mil
+69.468
6.56%
1 jan 2005 ano
1.208 mil
+79.261
7.02%
1 jan 2006 ano
1.275 mil
+67.395
5.58%
1 jan 2007 ano
1.371 mil
+95.871
7.52%
1 jan 2008 ano
1.467 mil
+96.286
7.02%
1 jan 2009 ano
1.513 mil
+45.161
3.08%
1 jan 2010 ano
1.547 mil
+34.708
2.29%
1 jan 2011 ano
1.67 mil
+122.53
7.92%
1 jan 2012 ano
1.783 mil
+113.246
6.78%
1 jan 2013 ano
1.838 mil
+54.584
3.06%
1 jan 2014 ano
1.916 mil
+78.816
4.29%
Classificação de países por estatísticas atuais por anos


Comentários: