29
/pt/
pt
AIzaSyAYiBZKx7MnpbEhh9jyipgxe19OcubqV5w
April 1, 2024
35872
High income
HIC
false
2
1
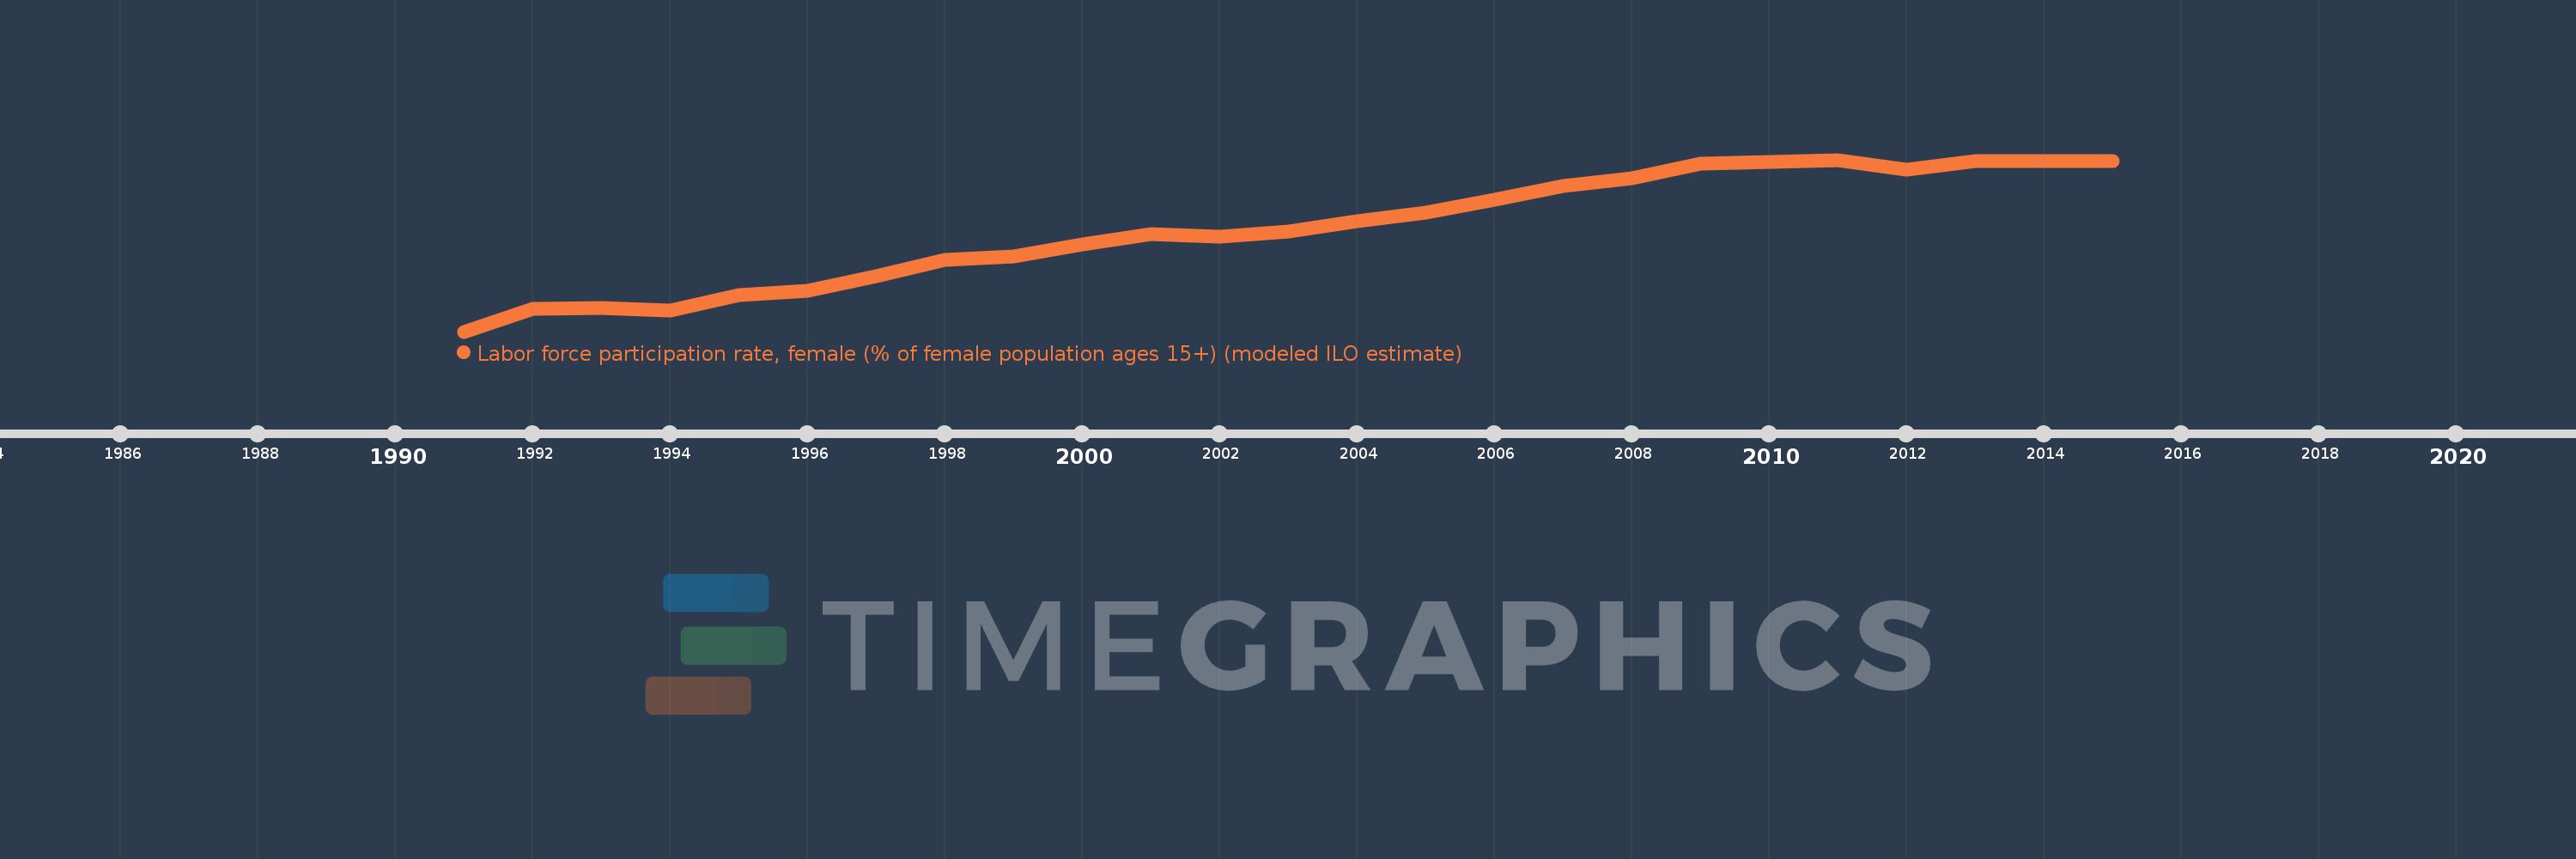
Labor force participation rate, female (% of female population ages 15+) (modeled ILO estimate)
2015,2014,2013,2012,2011,2010,2009,2008,2007,2006,2005,2004,2003,2002,2001,2000,1999,1998,1997,1996,1995,1994,1993,1992,1991
Estas estatísticas em outros países:
AfghanistanAlbaniaAlgeriaAngolaArab WorldArgentinaArmeniaAustraliaAustriaAzerbaijanBahamas, TheBahrainBangladeshBarbadosBelarusBelgiumBelizeBeninBhutanBoliviaBosnia and HerzegovinaBotswanaBrazilBrunei DarussalamBulgariaBurkina FasoBurundiCabo VerdeCambodiaCameroonCanadaCaribbean small statesCentral African RepublicCentral Europe and the BalticsChadChannel IslandsChileChinaColombiaComorosCongo, Dem. Rep.Congo, Rep.Costa RicaCote d'IvoireCroatiaCubaCyprusCzech RepublicDenmarkDjiboutiDominican RepublicEarly-demographic dividendEast Asia & PacificEast Asia & Pacific (excluding high income)East Asia & Pacific (IDA & IBRD countries)EcuadorEgypt, Arab Rep.El SalvadorEquatorial GuineaEritreaEstoniaEthiopiaEuro areaEurope & Central AsiaEurope & Central Asia (excluding high income)Europe & Central Asia (IDA & IBRD countries)European UnionFijiFinlandFragile and conflict affected situationsFranceFrench PolynesiaGabonGambia, TheGeorgiaGermanyGhanaGreeceGuamGuatemalaGuineaGuinea-BissauGuyanaHaitiHeavily indebted poor countries (HIPC)High incomeHondurasHong Kong SAR, ChinaHungaryIBRD onlyIcelandIDA & IBRD totalIDA blendIDA onlyIDA totalIndiaIndonesiaIran, Islamic Rep.IraqIrelandIsraelItalyJamaicaJapanJordanKazakhstanKenyaKorea, Dem. People’s Rep.Korea, Rep.KuwaitKyrgyz RepublicLao PDRLate-demographic dividendLatin America & Caribbean Latin America & Caribbean (excluding high income)Latin America & the Caribbean (IDA & IBRD countries)LatviaLeast developed countries: UN classificationLebanonLesothoLiberiaLibyaLithuaniaLow & middle incomeLow incomeLower middle incomeLuxembourgMacao SAR, ChinaMacedonia, FYRMadagascarMalawiMalaysiaMaldivesMaliMaltaMauritaniaMauritiusMexicoMiddle East & North AfricaMiddle East & North Africa (excluding high income)Middle East & North Africa (IDA & IBRD countries)Middle incomeMoldovaMongoliaMontenegroMoroccoMozambiqueMyanmarNamibiaNepalNetherlandsNew CaledoniaNew ZealandNicaraguaNigerNigeriaNorth AmericaNorwayOECD membersOmanOther small statesPacific island small statesPakistanPanamaPapua New GuineaParaguayPeruPhilippinesPolandPortugalPost-demographic dividendPre-demographic dividendPuerto RicoQatarRomaniaRussian FederationRwandaSamoaSao Tome and PrincipeSaudi ArabiaSenegalSerbiaSierra LeoneSingaporeSlovak RepublicSloveniaSmall statesSolomon IslandsSomaliaSouth AfricaSouth AsiaSouth Asia (IDA & IBRD)SpainSri LankaSt. LuciaSt. Vincent and the GrenadinesSub-Saharan Africa Sub-Saharan Africa (excluding high income)Sub-Saharan Africa (IDA & IBRD countries)SudanSurinameSwazilandSwedenSwitzerlandSyrian Arab RepublicTajikistanTanzaniaThailandTimor-LesteTogoTongaTrinidad and TobagoTunisiaTurkeyTurkmenistanUgandaUkraineUnited Arab EmiratesUnited KingdomUnited StatesUpper middle incomeUruguayUzbekistanVanuatuVenezuela, RBVietnamVirgin Islands (U.S.)West Bank and GazaWorldYemen, Rep.ZambiaZimbabwe Linha do tempo:
Nesta escala de tempo está apresentado um gráfico de 1991 ano até 2015 ano High income. Dados de 1990 ano ausente. O número de observações reais por data: 25.
Fonte (nome):
Indicadores de desenvolvimento mundial
Fonte (organização):
International Labour Organization, Key Indicators of the Labour Market database.
Categorias:
Social Protection & Labor, Gender, Social Development
Foi atualizado:
23 abr 2017 ano
Indicadores de alterações dos valores ao longo dos anos
Mínimo:
48.827
1 jan 1991 ano
Máximo:
52.145
1 jan 2011 ano
Na data de observação
Valor
Mudança absoluta
A alteração em relação ao valor anterior
1 jan 1991 ano
48.827
+48.827
0.0%
1 jan 1992 ano
49.267
+0.44
0.9%
1 jan 1993 ano
49.287
+0.02
0.04%
1 jan 1994 ano
49.236
-0.052
-0.1%
1 jan 1995 ano
49.537
+0.302
0.61%
1 jan 1996 ano
49.61
+0.073
0.15%
1 jan 1997 ano
49.898
+0.288
0.58%
1 jan 1998 ano
50.218
+0.32
0.64%
1 jan 1999 ano
50.274
+0.056
0.11%
1 jan 2000 ano
50.518
+0.244
0.49%
1 jan 2001 ano
50.708
+0.189
0.37%
1 jan 2002 ano
50.668
-0.04
-0.08%
1 jan 2003 ano
50.752
+0.085
0.17%
1 jan 2004 ano
50.956
+0.204
0.4%
1 jan 2005 ano
51.119
+0.163
0.32%
1 jan 2006 ano
51.376
+0.256
0.5%
1 jan 2007 ano
51.647
+0.271
0.53%
1 jan 2008 ano
51.788
+0.141
0.27%
1 jan 2009 ano
52.066
+0.279
0.54%
1 jan 2010 ano
52.096
+0.03
0.06%
1 jan 2011 ano
52.145
+0.049
0.09%
1 jan 2012 ano
51.954
-0.191
-0.37%
1 jan 2013 ano
52.121
+0.167
0.32%
1 jan 2014 ano
52.124
+0.002
0.0%
1 jan 2015 ano
52.114
-0.01
-0.02%
Classificação de países por estatísticas atuais por anos


Comentários: