30
/pt/
AIzaSyAYiBZKx7MnpbEhh9jyipgxe19OcubqV5w
April 1, 2024
34201
Fragile and conflict affected situations
FCS
false
2
1
Firms that do not report all sales for tax purposes (% of firms)
2011,2010,2008,2007,2004
Download
Biblioteca de estatísticas globais →Fragile and conflict affected situations →

Firms that do not report all sales for tax purposes (% of firms)

Estas estatísticas em outros países:

AlbaniaAlgeriaAngolaArab WorldArgentinaArmeniaAzerbaijanBelarusBeninBoliviaBosnia and HerzegovinaBotswanaBulgariaBurkina FasoBurundiCabo VerdeCambodiaCameroonCaribbean small statesCentral Europe and the BalticsChileChinaColombiaCongo, Dem. Rep.Congo, Rep.Costa RicaCote d'IvoireCroatiaCzech RepublicDominican RepublicEarly-demographic dividendEast Asia & PacificEast Asia & Pacific (excluding high income)East Asia & Pacific (IDA & IBRD countries)EcuadorEgypt, Arab Rep.El SalvadorEstoniaEthiopiaEuro areaEurope & Central AsiaEurope & Central Asia (excluding high income)Europe & Central Asia (IDA & IBRD countries)European UnionFragile and conflict affected situationsGabonGambia, TheGeorgiaGhanaGreeceGuatemalaGuineaGuinea-BissauGuyanaHeavily indebted poor countries (HIPC)High incomeHondurasHungaryIBRD onlyIDA & IBRD totalIDA blendIDA onlyIDA totalIndiaIndonesiaIrelandJamaicaJordanKazakhstanKenyaKorea, Rep.Kyrgyz RepublicLao PDRLate-demographic dividendLatin America & Caribbean Latin America & Caribbean (excluding high income)Latin America & the Caribbean (IDA & IBRD countries)LatviaLeast developed countries: UN classificationLebanonLiberiaLithuaniaLow & middle incomeLow incomeLower middle incomeMacedonia, FYRMadagascarMalawiMaliMauritaniaMauritiusMexicoMiddle East & North AfricaMiddle East & North Africa (excluding high income)Middle East & North Africa (IDA & IBRD countries)Middle incomeMoldovaMongoliaMontenegroMozambiqueNamibiaNicaraguaNigerNigeriaOECD membersOmanOther small statesPakistanPanamaParaguayPeruPolandPortugalPost-demographic dividendPre-demographic dividendRomaniaRussian FederationRwandaSenegalSerbiaSierra LeoneSlovak RepublicSloveniaSmall statesSouth AfricaSouth AsiaSouth Asia (IDA & IBRD)SpainSri LankaSub-Saharan Africa Sub-Saharan Africa (excluding high income)Sub-Saharan Africa (IDA & IBRD countries)SwazilandSyrian Arab RepublicTajikistanTanzaniaTurkeyUgandaUkraineUpper middle incomeUruguayUzbekistanVietnamWest Bank and GazaWorldYemen, Rep.Zambia

Linha do tempo:

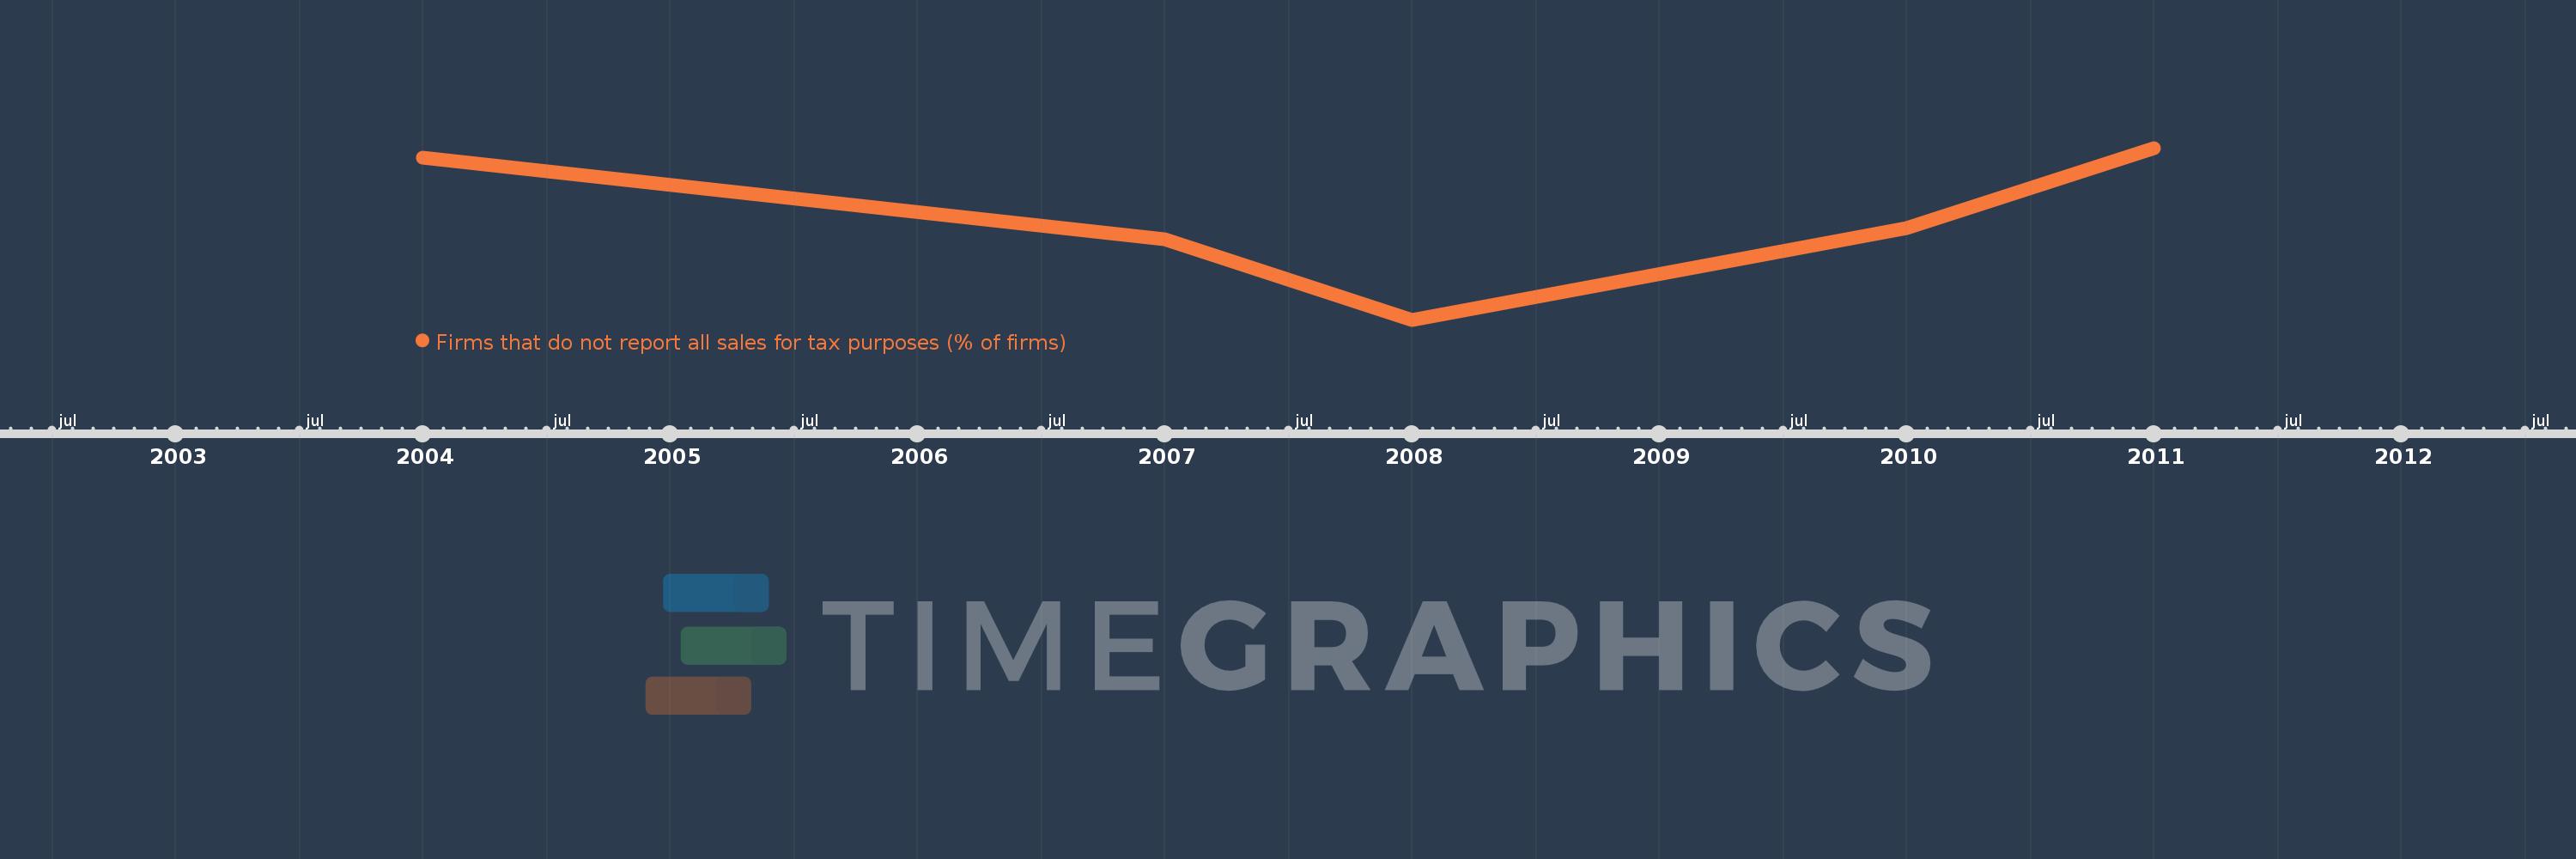
Nesta escala de tempo está apresentado um gráfico de 2004 ano até 2011 ano Fragile and conflict affected situations. Dados de 2003 ano ausente. O número de observações reais por data: 5.

Fonte (nome):

Indicadores de desenvolvimento mundial

Fonte (organização):

World Bank, Enterprise Surveys (http://www.enterprisesurveys.org/).

Categorias:

Private Sector

Foi atualizado:

23 abr 2017 ano

Indicadores de alterações dos valores ao longo dos anos

Em média:
64.798
Mínimo:
39.71
1 jan 2008 ano
Máximo:
82.33
1 jan 2011 ano
Na data de observação
Valor
Mudança absoluta
A alteração em relação ao valor anterior
1 jan 2004 ano
79.87
+79.87
0.0%
1 jan 2007 ano
59.59
-20.28
-25.39%
1 jan 2008 ano
39.71
-19.88
-33.36%
1 jan 2010 ano
62.492
+22.782
57.37%
1 jan 2011 ano
82.33
+19.838
31.75%

Classificação de países por estatísticas atuais por anos