29
/pt/
pt
AIzaSyAYiBZKx7MnpbEhh9jyipgxe19OcubqV5w
April 1, 2024
33764
European Union
EUU
false
2
1
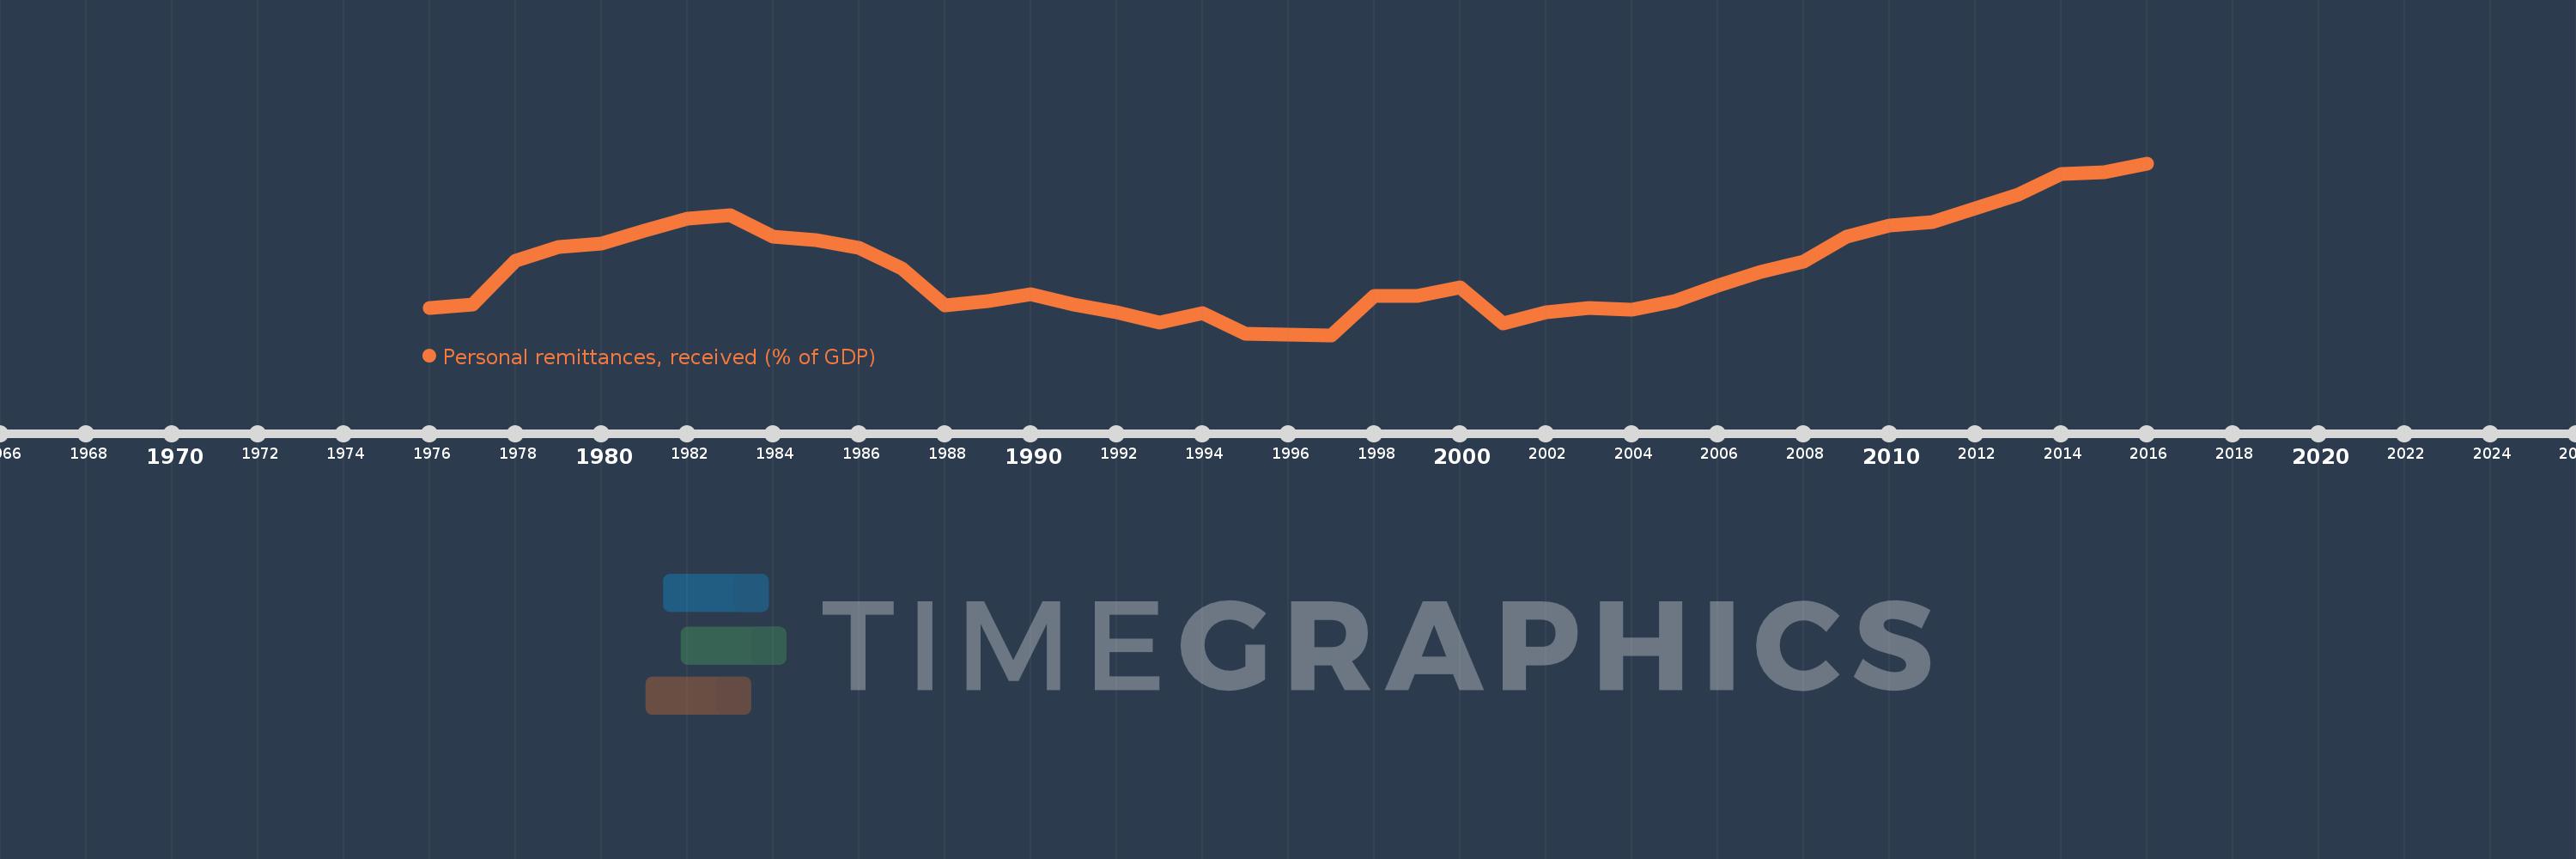
Personal remittances, received (% of GDP)
2016,2015,2014,2013,2012,2011,2010,2009,2008,2007,2006,2005,2004,2003,2002,2001,2000,1999,1998,1997,1996,1995,1994,1993,1992,1991,1990,1989,1988,1987,1986,1985,1984,1983,1982,1981,1980,1979,1978,1977,1976
Estas estatísticas em outros países:
AfghanistanAlbaniaAlgeriaAngolaAntigua and BarbudaArab WorldArgentinaArmeniaArubaAustraliaAustriaAzerbaijanBangladeshBarbadosBelarusBelgiumBelizeBeninBermudaBhutanBoliviaBosnia and HerzegovinaBotswanaBrazilBulgariaBurkina FasoBurundiCabo VerdeCambodiaCameroonCanadaCaribbean small statesCentral African RepublicCentral Europe and the BalticsChadChileChinaColombiaComorosCongo, Dem. Rep.Congo, Rep.Costa RicaCote d'IvoireCroatiaCyprusCzech RepublicDenmarkDjiboutiDominicaDominican RepublicEarly-demographic dividendEast Asia & PacificEast Asia & Pacific (excluding high income)East Asia & Pacific (IDA & IBRD countries)EcuadorEgypt, Arab Rep.El SalvadorEquatorial GuineaEritreaEstoniaEthiopiaEuro areaEurope & Central AsiaEurope & Central Asia (excluding high income)Europe & Central Asia (IDA & IBRD countries)European UnionFaroe IslandsFijiFinlandFragile and conflict affected situationsFranceGabonGambia, TheGeorgiaGermanyGhanaGreeceGrenadaGuatemalaGuineaGuinea-BissauGuyanaHaitiHeavily indebted poor countries (HIPC)High incomeHondurasHong Kong SAR, ChinaHungaryIBRD onlyIcelandIDA & IBRD totalIDA blendIDA onlyIDA totalIndiaIndonesiaIran, Islamic Rep.IraqIrelandIsraelItalyJamaicaJapanJordanKazakhstanKenyaKiribatiKorea, Rep.KosovoKuwaitKyrgyz RepublicLao PDRLate-demographic dividendLatin America & Caribbean Latin America & Caribbean (excluding high income)Latin America & the Caribbean (IDA & IBRD countries)LatviaLeast developed countries: UN classificationLebanonLesothoLiberiaLibyaLithuaniaLow & middle incomeLow incomeLower middle incomeLuxembourgMacao SAR, ChinaMacedonia, FYRMadagascarMalawiMalaysiaMaldivesMaliMaltaMarshall IslandsMauritaniaMauritiusMexicoMicronesia, Fed. Sts.Middle East & North AfricaMiddle East & North Africa (excluding high income)Middle East & North Africa (IDA & IBRD countries)Middle incomeMoldovaMongoliaMontenegroMoroccoMozambiqueMyanmarNamibiaNepalNetherlandsNew ZealandNicaraguaNigerNigeriaNorth AmericaNorwayOECD membersOmanOther small statesPacific island small statesPakistanPalauPanamaPapua New GuineaParaguayPeruPhilippinesPolandPortugalPost-demographic dividendPre-demographic dividendQatarRomaniaRussian FederationRwandaSamoaSao Tome and PrincipeSaudi ArabiaSenegalSerbiaSeychellesSierra LeoneSlovak RepublicSloveniaSmall statesSolomon IslandsSouth AfricaSouth AsiaSouth Asia (IDA & IBRD)South SudanSpainSri LankaSt. Kitts and NevisSt. LuciaSt. Vincent and the GrenadinesSub-Saharan Africa Sub-Saharan Africa (excluding high income)Sub-Saharan Africa (IDA & IBRD countries)SudanSurinameSwazilandSwedenSwitzerlandSyrian Arab RepublicTajikistanTanzaniaThailandTimor-LesteTogoTongaTrinidad and TobagoTunisiaTurkeyTurkmenistanTuvaluUgandaUkraineUnited KingdomUnited StatesUpper middle incomeUruguayUzbekistanVanuatuVenezuela, RBVietnamWest Bank and GazaWorldYemen, Rep.ZambiaZimbabwe Linha do tempo:
Nesta escala de tempo está apresentado um gráfico de 1976 ano até 2016 ano European Union. Dados de 1975 ano ausente. O número de observações reais por data: 41.
Fonte (nome):
Indicadores de desenvolvimento mundial
Fonte (organização):
World Bank staff estimates based on IMF balance of payments data, and World Bank and OECD GDP estimates.
Categorias:
Economy & Growth, Financial Sector
Foi atualizado:
23 abr 2017 ano
Indicadores de alterações dos valores ao longo dos anos
Mínimo:
0.371
1 jan 1997 ano
Máximo:
0.646
1 jan 2016 ano
Na data de observação
Valor
Mudança absoluta
A alteração em relação ao valor anterior
1 jan 1976 ano
0.414
+0.414
0.0%
1 jan 1977 ano
0.42
+0.006
1.36%
1 jan 1978 ano
0.49
+0.07
16.57%
1 jan 1979 ano
0.512
+0.022
4.55%
1 jan 1980 ano
0.518
+0.006
1.13%
1 jan 1981 ano
0.538
+0.021
3.99%
1 jan 1982 ano
0.558
+0.019
3.61%
1 jan 1983 ano
0.563
+0.006
1.01%
1 jan 1984 ano
0.529
-0.035
-6.13%
1 jan 1985 ano
0.523
-0.005
-1.0%
1 jan 1986 ano
0.51
-0.013
-2.54%
1 jan 1987 ano
0.478
-0.032
-6.23%
1 jan 1988 ano
0.419
-0.059
-12.43%
1 jan 1989 ano
0.425
+0.006
1.41%
1 jan 1990 ano
0.437
+0.012
2.87%
1 jan 1991 ano
0.42
-0.016
-3.77%
1 jan 1992 ano
0.407
-0.013
-3.14%
1 jan 1993 ano
0.391
-0.016
-3.97%
1 jan 1994 ano
0.406
+0.015
3.93%
1 jan 1995 ano
0.373
-0.033
-8.18%
1 jan 1996 ano
0.372
-0.001
-0.19%
1 jan 1997 ano
0.371
-0.002
-0.44%
1 jan 1998 ano
0.434
+0.064
17.16%
1 jan 1999 ano
0.434
0.0
-0.04%
1 jan 2000 ano
0.447
+0.013
3.0%
1 jan 2001 ano
0.39
-0.057
-12.76%
1 jan 2002 ano
0.407
+0.017
4.29%
1 jan 2003 ano
0.415
+0.008
2.04%
1 jan 2004 ano
0.412
-0.004
-0.9%
1 jan 2005 ano
0.425
+0.013
3.16%
1 jan 2006 ano
0.45
+0.025
5.92%
1 jan 2007 ano
0.472
+0.022
4.96%
1 jan 2008 ano
0.488
+0.016
3.38%
1 jan 2009 ano
0.528
+0.039
8.09%
1 jan 2010 ano
0.547
+0.02
3.7%
1 jan 2011 ano
0.552
+0.005
0.96%
1 jan 2012 ano
0.574
+0.021
3.84%
1 jan 2013 ano
0.596
+0.023
3.97%
1 jan 2014 ano
0.629
+0.033
5.53%
1 jan 2015 ano
0.631
+0.001
0.23%
1 jan 2016 ano
0.646
+0.015
2.4%
Classificação de países por estatísticas atuais por anos


Comentários: