29
/pt/
pt
AIzaSyAYiBZKx7MnpbEhh9jyipgxe19OcubqV5w
April 1, 2024
33351
European Union
EUU
false
2
1
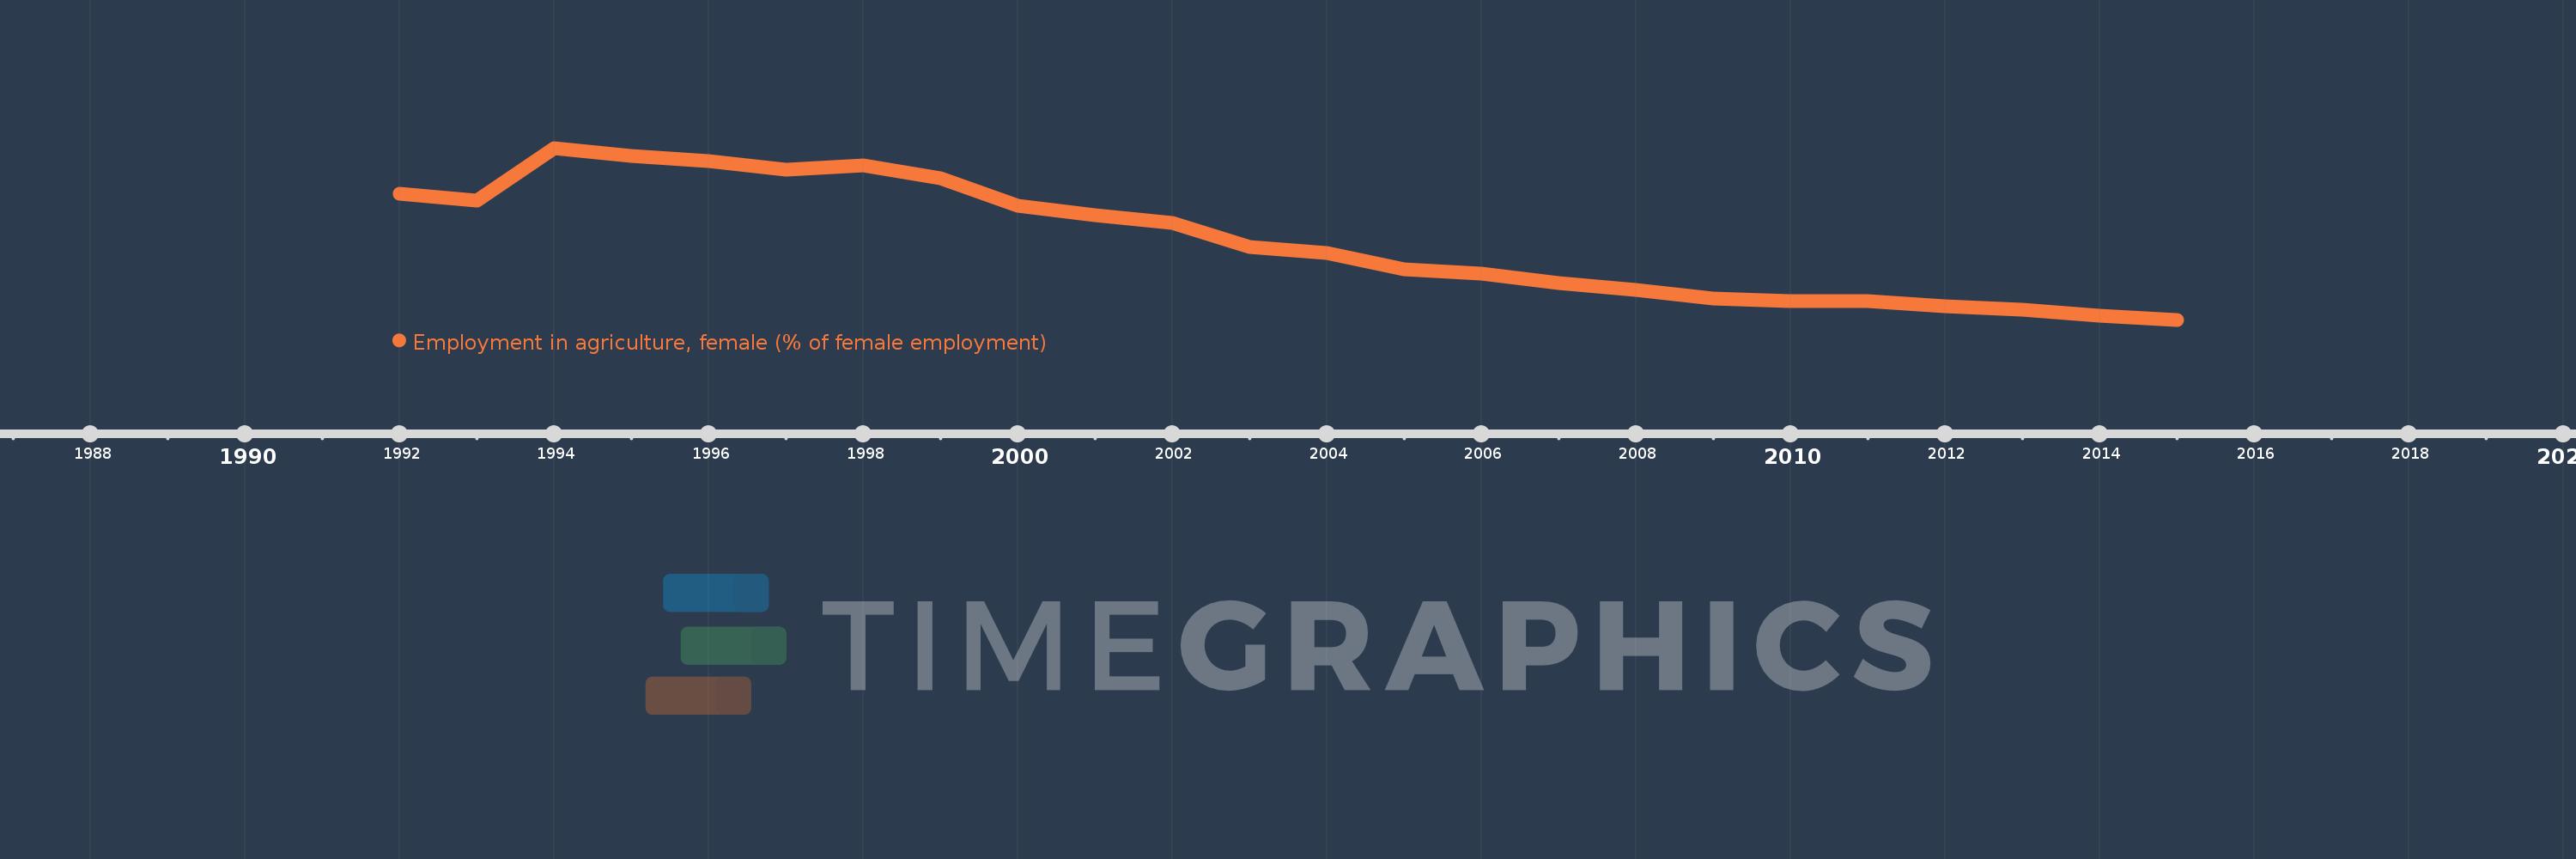
Employment in agriculture, female (% of female employment)
2015,2014,2013,2012,2011,2010,2009,2008,2007,2006,2005,2004,2003,2002,2001,2000,1999,1998,1997,1996,1995,1994,1993,1992
Estas estatísticas em outros países:
AlbaniaAlgeriaAmerican SamoaAntigua and BarbudaArab WorldArgentinaArmeniaArubaAustraliaAustriaAzerbaijanBahamas, TheBahrainBangladeshBarbadosBelarusBelgiumBelizeBeninBermudaBhutanBoliviaBotswanaBrazilBritish Virgin IslandsBrunei DarussalamBulgariaBurkina FasoBurundiCambodiaCameroonCanadaCaribbean small statesCayman IslandsCentral Europe and the BalticsChadChileChinaColombiaCongo, Rep.Costa RicaCroatiaCubaCyprusCzech RepublicDenmarkDominicaDominican RepublicEarly-demographic dividendEast Asia & PacificEast Asia & Pacific (excluding high income)East Asia & Pacific (IDA & IBRD countries)EcuadorEgypt, Arab Rep.El SalvadorEquatorial GuineaEstoniaEthiopiaEuro areaEurope & Central AsiaEurope & Central Asia (excluding high income)Europe & Central Asia (IDA & IBRD countries)European UnionFaroe IslandsFijiFinlandFranceGabonGambia, TheGeorgiaGermanyGhanaGreeceGreenlandGrenadaGuatemalaGuineaGuyanaHaitiHigh incomeHondurasHong Kong SAR, ChinaHungaryIBRD onlyIcelandIDA & IBRD totalIDA blendIndiaIndonesiaIran, Islamic Rep.IraqIrelandIsle of ManIsraelItalyJamaicaJapanJordanKazakhstanKenyaKiribatiKorea, Rep.KosovoKuwaitKyrgyz RepublicLao PDRLate-demographic dividendLatin America & Caribbean Latin America & Caribbean (excluding high income)Latin America & the Caribbean (IDA & IBRD countries)LatviaLesothoLiberiaLithuaniaLow & middle incomeLower middle incomeLuxembourgMacao SAR, ChinaMacedonia, FYRMadagascarMalawiMalaysiaMaldivesMaliMaltaMarshall IslandsMauritiusMexicoMiddle East & North AfricaMiddle East & North Africa (excluding high income)Middle East & North Africa (IDA & IBRD countries)Middle incomeMoldovaMongoliaMontenegroMoroccoMozambiqueNamibiaNepalNetherlandsNew CaledoniaNew ZealandNicaraguaNigerNigeriaNorth AmericaNorthern Mariana IslandsNorwayOECD membersOmanPakistanPalauPanamaParaguayPeruPhilippinesPolandPortugalPost-demographic dividendPuerto RicoQatarRomaniaRussian FederationRwandaSamoaSan MarinoSao Tome and PrincipeSaudi ArabiaSenegalSerbiaSeychellesSierra LeoneSingaporeSlovak RepublicSloveniaSouth AfricaSouth AsiaSouth Asia (IDA & IBRD)SpainSri LankaSt. Kitts and NevisSt. LuciaSt. Vincent and the GrenadinesSudanSurinameSwedenSwitzerlandSyrian Arab RepublicTajikistanTanzaniaThailandTimor-LesteTogoTongaTrinidad and TobagoTunisiaTurkeyUgandaUkraineUnited Arab EmiratesUnited KingdomUnited StatesUpper middle incomeUruguayVanuatuVenezuela, RBVietnamWest Bank and GazaWorldYemen, Rep.ZambiaZimbabwe Linha do tempo:
Nesta escala de tempo está apresentado um gráfico de 1992 ano até 2015 ano European Union. Dados de 1991 ano ausente. O número de observações reais por data: 24.
Fonte (nome):
Indicadores de desenvolvimento mundial
Fonte (organização):
International Labour Organization, Key Indicators of the Labour Market database.
Categorias:
Agriculture & Rural Development, Social Protection & Labor, Gender
Foi atualizado:
23 abr 2017 ano
Indicadores de alterações dos valores ao longo dos anos
Mínimo:
3.393
1 jan 2015 ano
Máximo:
8.848
1 jan 1994 ano
Na data de observação
Valor
Mudança absoluta
A alteração em relação ao valor anterior
1 jan 1992 ano
7.394
+7.394
0.0%
1 jan 1993 ano
7.183
-0.211
-2.86%
1 jan 1994 ano
8.848
+1.666
23.19%
1 jan 1995 ano
8.589
-0.259
-2.93%
1 jan 1996 ano
8.424
-0.165
-1.92%
1 jan 1997 ano
8.164
-0.261
-3.1%
1 jan 1998 ano
8.298
+0.135
1.65%
1 jan 1999 ano
7.895
-0.404
-4.86%
1 jan 2000 ano
7.005
-0.89
-11.27%
1 jan 2001 ano
6.712
-0.293
-4.18%
1 jan 2002 ano
6.479
-0.233
-3.47%
1 jan 2003 ano
5.709
-0.77
-11.88%
1 jan 2004 ano
5.521
-0.188
-3.29%
1 jan 2005 ano
4.992
-0.529
-9.58%
1 jan 2006 ano
4.863
-0.129
-2.58%
1 jan 2007 ano
4.564
-0.299
-6.15%
1 jan 2008 ano
4.336
-0.228
-4.99%
1 jan 2009 ano
4.058
-0.279
-6.43%
1 jan 2010 ano
3.992
-0.065
-1.6%
1 jan 2011 ano
3.98
-0.013
-0.32%
1 jan 2012 ano
3.812
-0.168
-4.22%
1 jan 2013 ano
3.72
-0.092
-2.4%
1 jan 2014 ano
3.516
-0.204
-5.49%
1 jan 2015 ano
3.393
-0.123
-3.51%
Classificação de países por estatísticas atuais por anos


Comentários: