29
/pt/
pt
AIzaSyAYiBZKx7MnpbEhh9jyipgxe19OcubqV5w
April 1, 2024
30421
Europe & Central Asia
ECS
false
2
1
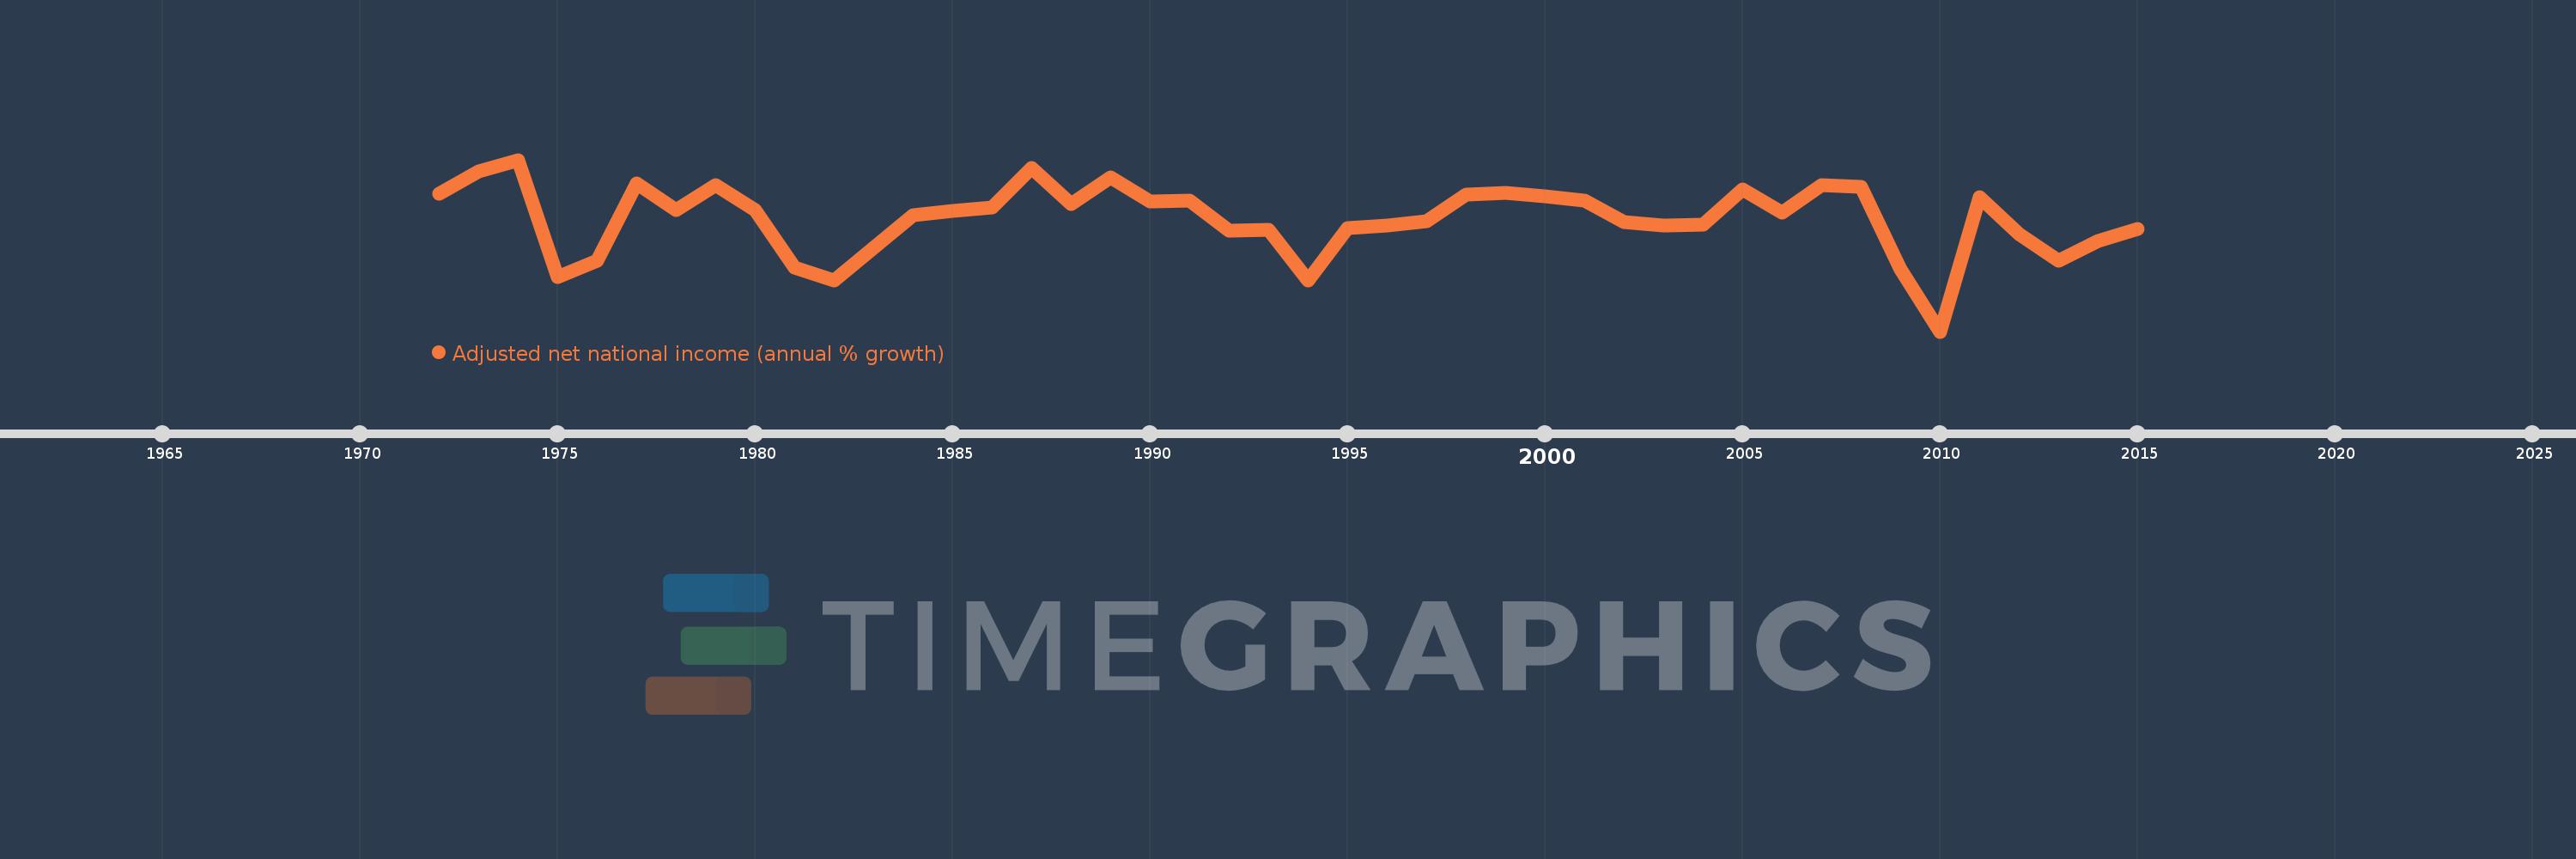
Adjusted net national income (annual % growth)
2015,2014,2013,2012,2011,2010,2009,2008,2007,2006,2005,2004,2003,2002,2001,2000,1999,1998,1997,1996,1995,1994,1993,1992,1991,1990,1989,1988,1987,1986,1985,1984,1983,1982,1981,1980,1979,1978,1977,1976,1975,1974,1973,1972
Estas estatísticas em outros países:
Linha do tempo:
Nesta escala de tempo está apresentado um gráfico de 1972 ano até 2015 ano Europe & Central Asia. Dados de 1971 ano ausente. O número de observações reais por data: 44.
Fonte (nome):
Indicadores de desenvolvimento mundial
Fonte (organização):
World Bank staff estimates based on sources and methods in World Bank's "The Changing Wealth of Nations: Measuring Sustainable Development in the New Millennium" (2011).
Categorias:
Economy & Growth
Foi atualizado:
23 abr 2017 ano
Indicadores de alterações dos valores ao longo dos anos
Mínimo:
-3.844
1 jan 2010 ano
Máximo:
5.306
1 jan 1974 ano
Na data de observação
Valor
Mudança absoluta
A alteração em relação ao valor anterior
1 jan 1972 ano
3.51
+3.51
0.0%
1 jan 1973 ano
4.686
+1.176
33.51%
1 jan 1974 ano
5.306
+0.62
13.24%
1 jan 1975 ano
-0.922
-6.228
-117.38%
1 jan 1976 ano
-0.085
+0.837
-90.75%
1 jan 1977 ano
4.037
+4.122
-4.83 mil%
1 jan 1978 ano
2.612
-1.425
-35.29%
1 jan 1979 ano
3.974
+1.362
52.14%
1 jan 1980 ano
2.607
-1.367
-34.4%
1 jan 1981 ano
-0.435
-3.042
-116.67%
1 jan 1982 ano
-1.119
-0.684
157.45%
1 jan 1983 ano
0.607
+1.726
-154.23%
1 jan 1984 ano
2.336
+1.73
285.04%
1 jan 1985 ano
2.591
+0.254
10.88%
1 jan 1986 ano
2.76
+0.169
6.53%
1 jan 1987 ano
4.859
+2.099
76.07%
1 jan 1988 ano
2.942
-1.918
-39.46%
1 jan 1989 ano
4.372
+1.431
48.64%
1 jan 1990 ano
3.096
-1.277
-29.21%
1 jan 1991 ano
3.138
+0.042
1.36%
1 jan 1992 ano
1.527
-1.61
-51.32%
1 jan 1993 ano
1.575
+0.048
3.13%
1 jan 1994 ano
-1.11
-2.685
-170.48%
1 jan 1995 ano
1.647
+2.757
-248.38%
1 jan 1996 ano
1.801
+0.154
9.36%
1 jan 1997 ano
2.026
+0.225
12.47%
1 jan 1998 ano
3.435
+1.41
69.58%
1 jan 1999 ano
3.532
+0.097
2.81%
1 jan 2000 ano
3.35
-0.183
-5.17%
1 jan 2001 ano
3.119
-0.231
-6.88%
1 jan 2002 ano
1.979
-1.14
-36.56%
1 jan 2003 ano
1.787
-0.191
-9.66%
1 jan 2004 ano
1.874
+0.087
4.87%
1 jan 2005 ano
3.72
+1.846
98.47%
1 jan 2006 ano
2.514
-1.206
-32.42%
1 jan 2007 ano
3.956
+1.442
57.35%
1 jan 2008 ano
3.873
-0.082
-2.09%
1 jan 2009 ano
-0.537
-4.41
-113.85%
1 jan 2010 ano
-3.844
-3.308
616.42%
1 jan 2011 ano
3.308
+7.152
-186.05%
1 jan 2012 ano
1.365
-1.943
-58.75%
1 jan 2013 ano
-0.082
-1.447
-106.02%
1 jan 2014 ano
0.965
+1.047
-1.28 mil%
1 jan 2015 ano
1.635
+0.67
69.38%
Classificação de países por estatísticas atuais por anos


Comentários: