29
/pt/
pt
AIzaSyAYiBZKx7MnpbEhh9jyipgxe19OcubqV5w
April 1, 2024
285898
Zambia
ZMB
true
2
1
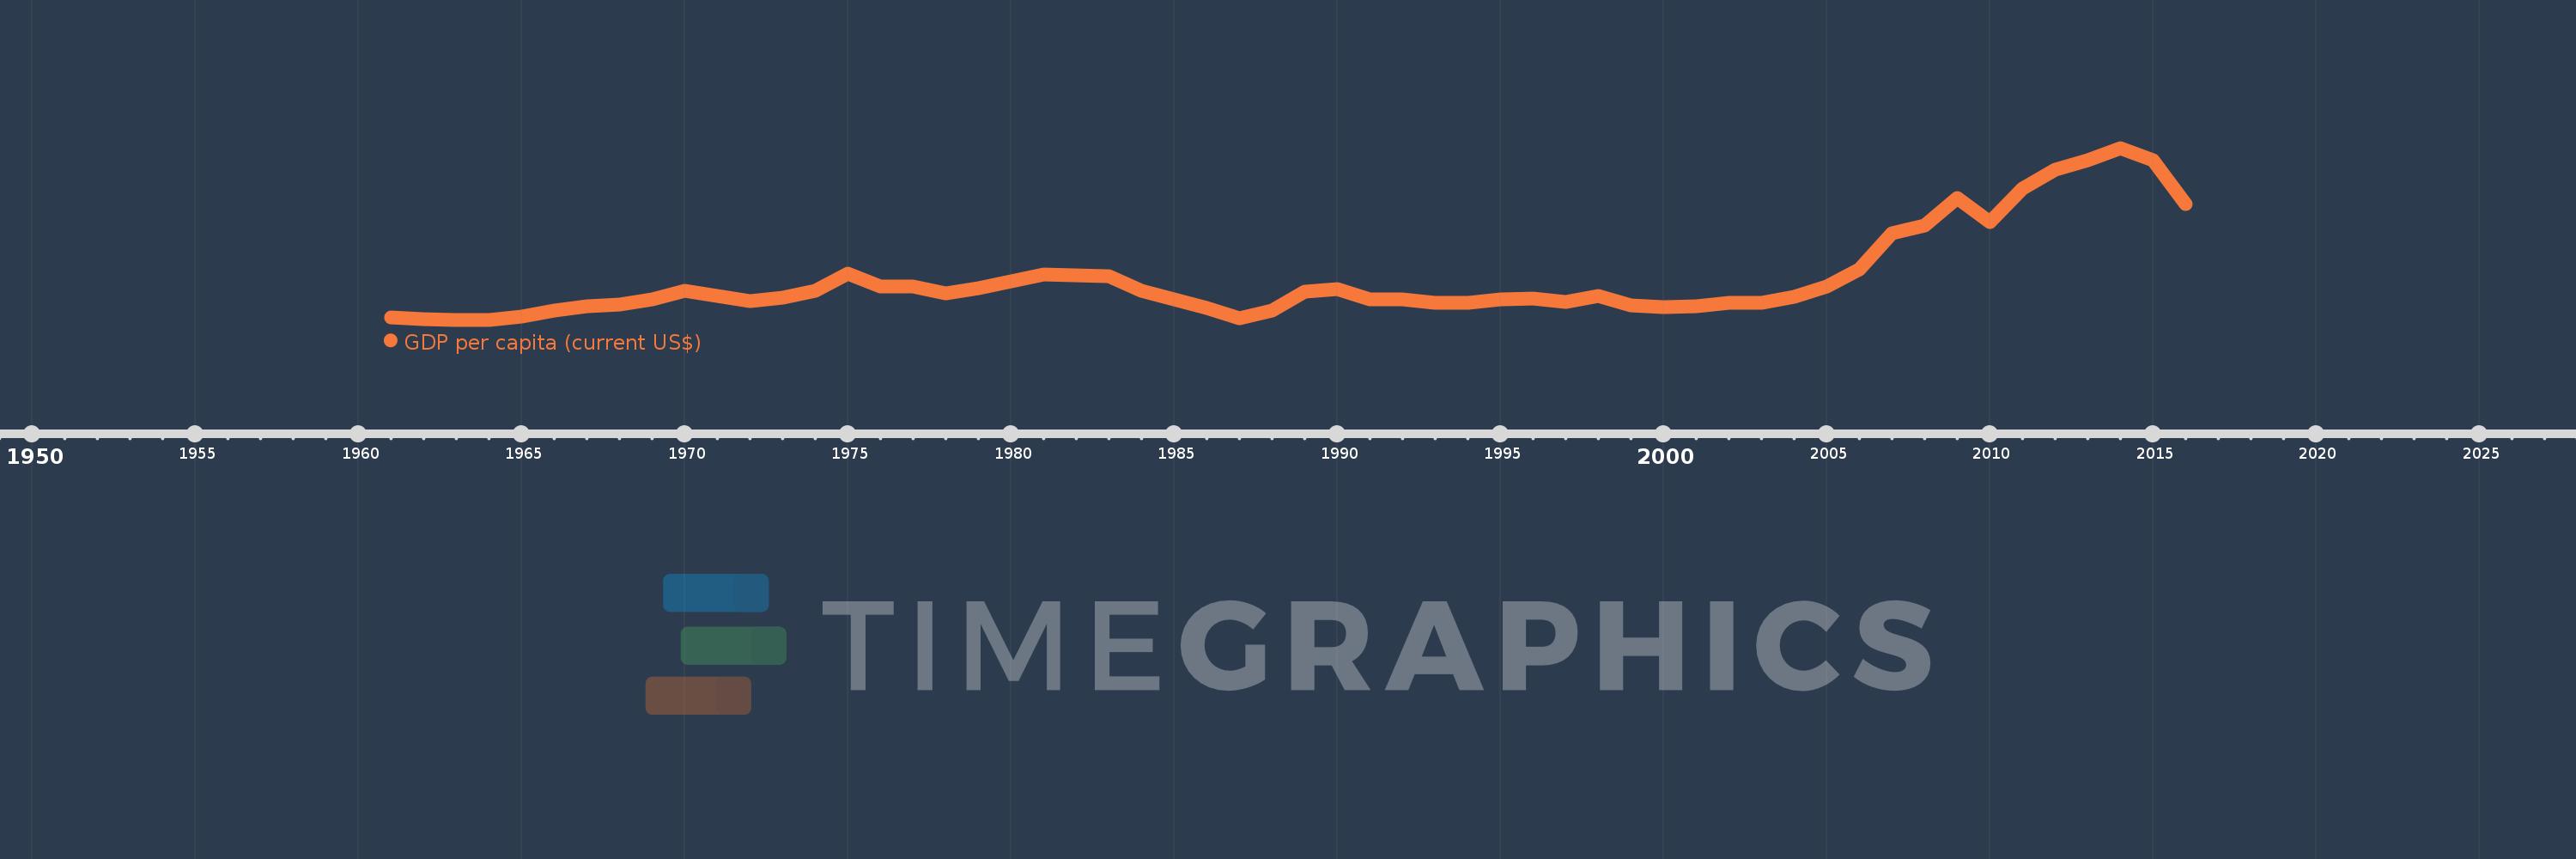
GDP per capita (current US$)
2016,2015,2014,2013,2012,2011,2010,2009,2008,2007,2006,2005,2004,2003,2002,2001,2000,1999,1998,1997,1996,1995,1994,1993,1992,1991,1990,1989,1988,1987,1986,1985,1984,1983,1982,1981,1980,1979,1978,1977,1976,1975,1974,1973,1972,1971,1970,1969,1968,1967,1966,1965,1964,1963,1962,1961
Estas estatísticas em outros países:
AfghanistanAlbaniaAlgeriaAndorraAngolaAntigua and BarbudaArab WorldArgentinaArmeniaArubaAustraliaAustriaAzerbaijanBahamas, TheBahrainBangladeshBarbadosBelarusBelgiumBelizeBeninBermudaBhutanBoliviaBosnia and HerzegovinaBotswanaBrazilBrunei DarussalamBulgariaBurkina FasoBurundiCabo VerdeCambodiaCameroonCanadaCaribbean small statesCayman IslandsCentral African RepublicCentral Europe and the BalticsChadChannel IslandsChileChinaColombiaComorosCongo, Dem. Rep.Congo, Rep.Costa RicaCote d'IvoireCroatiaCubaCyprusCzech RepublicDenmarkDjiboutiDominicaDominican RepublicEarly-demographic dividendEast Asia & PacificEast Asia & Pacific (excluding high income)East Asia & Pacific (IDA & IBRD countries)EcuadorEgypt, Arab Rep.El SalvadorEquatorial GuineaEritreaEstoniaEthiopiaEuro areaEurope & Central AsiaEurope & Central Asia (excluding high income)Europe & Central Asia (IDA & IBRD countries)European UnionFaroe IslandsFijiFinlandFragile and conflict affected situationsFranceFrench PolynesiaGabonGambia, TheGeorgiaGermanyGhanaGreeceGreenlandGrenadaGuatemalaGuineaGuinea-BissauGuyanaHaitiHeavily indebted poor countries (HIPC)High incomeHondurasHong Kong SAR, ChinaHungaryIBRD onlyIcelandIDA & IBRD totalIDA blendIDA onlyIDA totalIndiaIndonesiaIran, Islamic Rep.IraqIrelandIsle of ManIsraelItalyJamaicaJapanJordanKazakhstanKenyaKiribatiKorea, Rep.KosovoKuwaitKyrgyz RepublicLao PDRLate-demographic dividendLatin America & Caribbean Latin America & Caribbean (excluding high income)Latin America & the Caribbean (IDA & IBRD countries)LatviaLeast developed countries: UN classificationLebanonLesothoLiberiaLibyaLiechtensteinLithuaniaLow & middle incomeLow incomeLower middle incomeLuxembourgMacao SAR, ChinaMacedonia, FYRMadagascarMalawiMalaysiaMaldivesMaliMaltaMarshall IslandsMauritaniaMauritiusMexicoMicronesia, Fed. Sts.Middle East & North AfricaMiddle East & North Africa (excluding high income)Middle East & North Africa (IDA & IBRD countries)Middle incomeMoldovaMonacoMongoliaMontenegroMoroccoMozambiqueMyanmarNamibiaNauruNepalNetherlandsNew CaledoniaNew ZealandNicaraguaNigerNigeriaNorth AmericaNorwayOECD membersOmanOther small statesPacific island small statesPakistanPalauPanamaPapua New GuineaParaguayPeruPhilippinesPolandPortugalPost-demographic dividendPre-demographic dividendPuerto RicoQatarRomaniaRussian FederationRwandaSamoaSan MarinoSao Tome and PrincipeSaudi ArabiaSenegalSerbiaSeychellesSierra LeoneSingaporeSlovak RepublicSloveniaSmall statesSolomon IslandsSomaliaSouth AfricaSouth AsiaSouth Asia (IDA & IBRD)South SudanSpainSri LankaSt. Kitts and NevisSt. LuciaSt. Vincent and the GrenadinesSub-Saharan Africa Sub-Saharan Africa (excluding high income)Sub-Saharan Africa (IDA & IBRD countries)SudanSurinameSwazilandSwedenSwitzerlandSyrian Arab RepublicTajikistanTanzaniaThailandTimor-LesteTogoTongaTrinidad and TobagoTunisiaTurkeyTurkmenistanTuvaluUgandaUkraineUnited Arab EmiratesUnited KingdomUnited StatesUpper middle incomeUruguayUzbekistanVanuatuVenezuela, RBVietnamVirgin Islands (U.S.)West Bank and GazaWorldYemen, Rep.ZambiaZimbabwe Linha do tempo:
Nesta escala de tempo está apresentado um gráfico de 1961 ano até 2016 ano Zambia. Dados de 1960 ano ausente. O número de observações reais por data: 56.
Fonte (nome):
Indicadores de desenvolvimento mundial
Fonte (organização):
World Bank national accounts data, and OECD National Accounts data files.
Categorias:
Economy & Growth
Foi atualizado:
23 abr 2017 ano
Indicadores de alterações dos valores ao longo dos anos
Mínimo:
213.889
1 jan 1963 ano
Máximo:
1.84 mil
1 jan 2014 ano
Na data de observação
Valor
Mudança absoluta
A alteração em relação ao valor anterior
1 jan 1961 ano
233.802
+233.802
0.0%
1 jan 1962 ano
221.546
-12.256
-5.24%
1 jan 1963 ano
213.889
-7.657
-3.46%
1 jan 1964 ano
214.998
+1.108
0.52%
1 jan 1965 ano
243.364
+28.367
13.19%
1 jan 1966 ano
304.2
+60.836
25.0%
1 jan 1967 ano
344.109
+39.909
13.12%
1 jan 1968 ano
360.677
+16.569
4.81%
1 jan 1969 ano
409.979
+49.301
13.67%
1 jan 1970 ano
485.664
+75.685
18.46%
1 jan 1971 ano
436.11
-49.554
-10.2%
1 jan 1972 ano
389.517
-46.593
-10.68%
1 jan 1973 ano
426.105
+36.588
9.39%
1 jan 1974 ano
488.491
+62.386
14.64%
1 jan 1975 ano
648.921
+160.429
32.84%
1 jan 1976 ano
525.518
-123.402
-19.02%
1 jan 1977 ano
532.25
+6.732
1.28%
1 jan 1978 ano
464.672
-67.578
-12.7%
1 jan 1979 ano
508.532
+43.859
9.44%
1 jan 1980 ano
580.612
+72.08
14.17%
1 jan 1981 ano
645.839
+65.227
11.23%
1 jan 1982 ano
630.926
-14.913
-2.31%
1 jan 1983 ano
628.845
-2.081
-0.33%
1 jan 1984 ano
489.42
-139.425
-22.17%
1 jan 1985 ano
403.233
-86.187
-17.61%
1 jan 1986 ano
325.091
-78.142
-19.38%
1 jan 1987 ano
229.472
-95.619
-29.41%
1 jan 1988 ano
303.898
+74.426
32.43%
1 jan 1989 ano
482.534
+178.636
58.78%
1 jan 1990 ano
504.813
+22.279
4.62%
1 jan 1991 ano
403.434
-101.379
-20.08%
1 jan 1992 ano
404.106
+0.672
0.17%
1 jan 1993 ano
370.984
-33.122
-8.2%
1 jan 1994 ano
372.21
+1.226
0.33%
1 jan 1995 ano
405.473
+33.263
8.94%
1 jan 1996 ano
411.418
+5.945
1.47%
1 jan 1997 ano
378.561
-32.857
-7.99%
1 jan 1998 ano
440.741
+62.18
16.43%
1 jan 1999 ano
352.555
-88.186
-20.01%
1 jan 2000 ano
330.217
-22.338
-6.34%
1 jan 2001 ano
340.161
+9.944
3.01%
1 jan 2002 ano
376.981
+36.82
10.82%
1 jan 2003 ano
376.468
-0.513
-0.14%
1 jan 2004 ano
429.007
+52.539
13.96%
1 jan 2005 ano
530.554
+101.546
23.67%
1 jan 2006 ano
691.809
+161.256
30.39%
1 jan 2007 ano
1.03 mil
+338.506
48.93%
1 jan 2008 ano
1.103 mil
+73.171
7.1%
1 jan 2009 ano
1.366 mil
+262.235
23.76%
1 jan 2010 ano
1.135 mil
-230.948
-16.91%
1 jan 2011 ano
1.456 mil
+321.354
28.32%
1 jan 2012 ano
1.636 mil
+179.461
12.32%
1 jan 2013 ano
1.725 mil
+89.177
5.45%
1 jan 2014 ano
1.84 mil
+114.754
6.65%
1 jan 2015 ano
1.727 mil
-112.526
-6.12%
1 jan 2016 ano
1.305 mil
-422.114
-24.44%
Classificação de países por estatísticas atuais por anos


Comentários: