29
/pt/
pt
AIzaSyAYiBZKx7MnpbEhh9jyipgxe19OcubqV5w
April 1, 2024
28458
East Asia & Pacific (excluding high income)
EAP
false
2
1
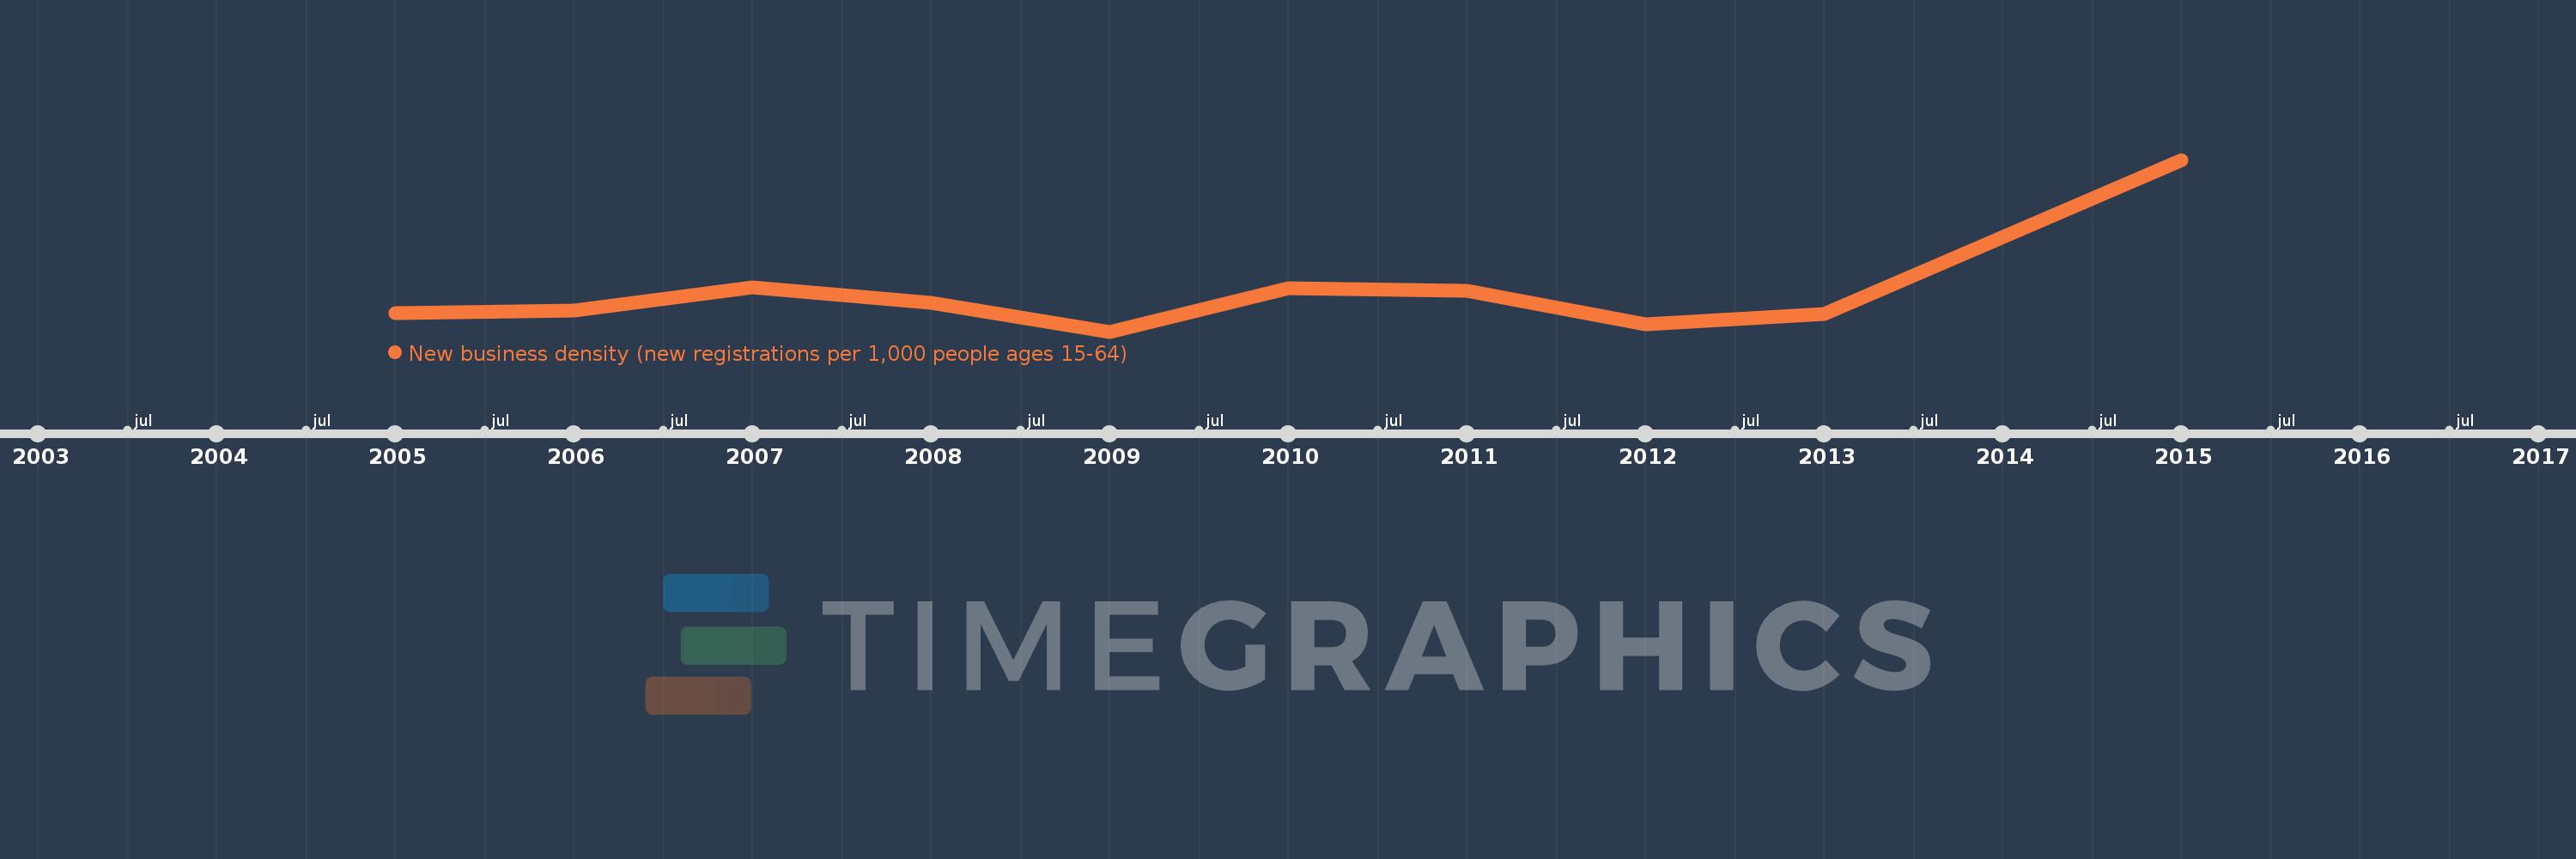
New business density (new registrations per 1,000 people ages 15-64)
2015,2013,2012,2011,2010,2009,2008,2007,2006,2005
Estas estatísticas em outros países:
Linha do tempo:
Nesta escala de tempo está apresentado um gráfico de 2005 ano até 2015 ano East Asia & Pacific (excluding high income). Dados de 2004 ano ausente. O número de observações reais por data: 10.
Fonte (nome):
Indicadores de desenvolvimento mundial
Fonte (organização):
World Bank's Entrepreneurship Survey and database (http://econ.worldbank.org/research/entrepreneurship).
Categorias:
Private Sector
Foi atualizado:
23 abr 2017 ano
Indicadores de alterações dos valores ao longo dos anos
Mínimo:
1.086
1 jan 2009 ano
Máximo:
3.553
1 jan 2015 ano
Na data de observação
Valor
Mudança absoluta
A alteração em relação ao valor anterior
1 jan 2005 ano
1.357
+1.357
0.0%
1 jan 2006 ano
1.392
+0.034
2.53%
1 jan 2007 ano
1.716
+0.324
23.29%
1 jan 2008 ano
1.498
-0.218
-12.69%
1 jan 2009 ano
1.086
-0.412
-27.52%
1 jan 2010 ano
1.706
+0.62
57.11%
1 jan 2011 ano
1.666
-0.039
-2.31%
1 jan 2012 ano
1.19
-0.477
-28.61%
1 jan 2013 ano
1.344
+0.154
12.95%
1 jan 2015 ano
3.553
+2.209
164.38%
Classificação de países por estatísticas atuais por anos


Comentários: