29
/pt/
pt
AIzaSyAYiBZKx7MnpbEhh9jyipgxe19OcubqV5w
April 1, 2024
28217
East Asia & Pacific (excluding high income)
EAP
false
2
1
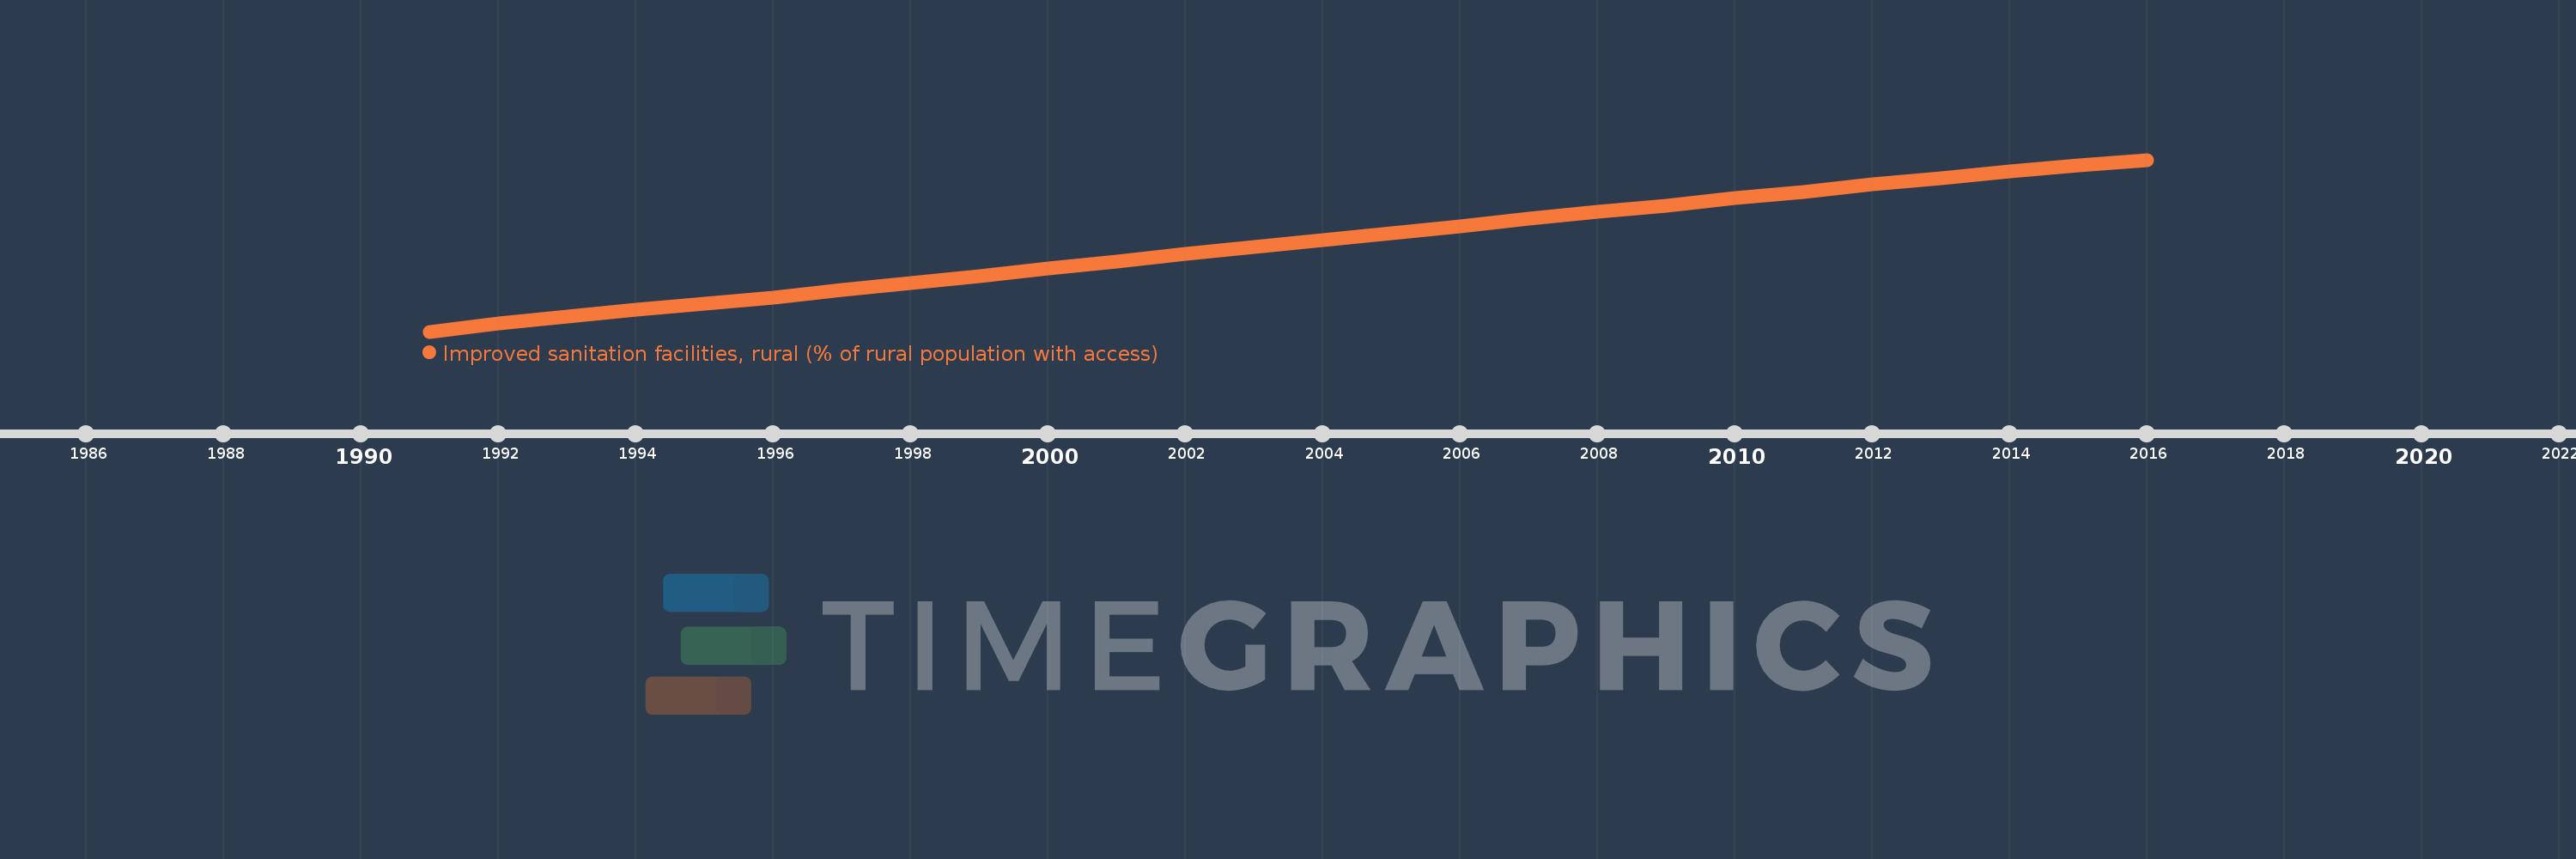
Improved sanitation facilities, rural (% of rural population with access)
2016,2015,2014,2013,2012,2011,2010,2009,2008,2007,2006,2005,2004,2003,2002,2001,2000,1999,1998,1997,1996,1995,1994,1993,1992,1991
Estas estatísticas em outros países:
AfghanistanAlbaniaAlgeriaAmerican SamoaAndorraAngolaAntigua and BarbudaArab WorldArgentinaArmeniaArubaAustraliaAustriaAzerbaijanBahamas, TheBahrainBangladeshBarbadosBelarusBelgiumBelizeBeninBhutanBoliviaBosnia and HerzegovinaBotswanaBrazilBritish Virgin IslandsBulgariaBurkina FasoBurundiCabo VerdeCambodiaCameroonCanadaCaribbean small statesCentral African RepublicCentral Europe and the BalticsChadChileChinaColombiaComorosCongo, Dem. Rep.Congo, Rep.Costa RicaCote d'IvoireCroatiaCubaCyprusCzech RepublicDenmarkDjiboutiDominicaDominican RepublicEarly-demographic dividendEast Asia & PacificEast Asia & Pacific (excluding high income)East Asia & Pacific (IDA & IBRD countries)EcuadorEgypt, Arab Rep.El SalvadorEquatorial GuineaEritreaEstoniaEthiopiaEuro areaEurope & Central AsiaEurope & Central Asia (excluding high income)Europe & Central Asia (IDA & IBRD countries)European UnionFijiFinlandFragile and conflict affected situationsFranceFrench PolynesiaGabonGambia, TheGeorgiaGermanyGhanaGreeceGreenlandGrenadaGuamGuatemalaGuineaGuinea-BissauGuyanaHaitiHeavily indebted poor countries (HIPC)High incomeHondurasHungaryIBRD onlyIcelandIDA & IBRD totalIDA blendIDA onlyIDA totalIndiaIndonesiaIran, Islamic Rep.IraqIrelandIsraelItalyJamaicaJapanJordanKazakhstanKenyaKiribatiKorea, Dem. People’s Rep.Korea, Rep.KuwaitKyrgyz RepublicLao PDRLate-demographic dividendLatin America & Caribbean Latin America & Caribbean (excluding high income)Latin America & the Caribbean (IDA & IBRD countries)LatviaLeast developed countries: UN classificationLebanonLesothoLiberiaLibyaLithuaniaLow & middle incomeLow incomeLower middle incomeLuxembourgMacedonia, FYRMadagascarMalawiMalaysiaMaldivesMaliMaltaMarshall IslandsMauritaniaMauritiusMexicoMicronesia, Fed. Sts.Middle East & North AfricaMiddle East & North Africa (excluding high income)Middle East & North Africa (IDA & IBRD countries)Middle incomeMoldovaMongoliaMontenegroMoroccoMozambiqueMyanmarNamibiaNepalNetherlandsNew CaledoniaNew ZealandNicaraguaNigerNigeriaNorth AmericaNorthern Mariana IslandsNorwayOECD membersOmanOther small statesPacific island small statesPakistanPalauPanamaPapua New GuineaParaguayPeruPhilippinesPolandPortugalPost-demographic dividendPre-demographic dividendPuerto RicoQatarRomaniaRussian FederationRwandaSamoaSao Tome and PrincipeSaudi ArabiaSenegalSerbiaSeychellesSierra LeoneSlovak RepublicSloveniaSmall statesSolomon IslandsSomaliaSouth AfricaSouth AsiaSouth Asia (IDA & IBRD)South SudanSpainSri LankaSt. Kitts and NevisSt. LuciaSt. Vincent and the GrenadinesSub-Saharan Africa Sub-Saharan Africa (excluding high income)Sub-Saharan Africa (IDA & IBRD countries)SudanSurinameSwazilandSwedenSwitzerlandSyrian Arab RepublicTajikistanTanzaniaThailandTimor-LesteTogoTongaTrinidad and TobagoTunisiaTurkeyTurkmenistanTurks and Caicos IslandsTuvaluUgandaUkraineUnited Arab EmiratesUnited KingdomUnited StatesUpper middle incomeUruguayUzbekistanVanuatuVenezuela, RBVietnamVirgin Islands (U.S.)West Bank and GazaWorldYemen, Rep.ZambiaZimbabwe Linha do tempo:
Nesta escala de tempo está apresentado um gráfico de 1991 ano até 2016 ano East Asia & Pacific (excluding high income). Dados de 1990 ano ausente. O número de observações reais por data: 26.
Fonte (nome):
Indicadores de desenvolvimento mundial
Fonte (organização):
WHO/UNICEF Joint Monitoring Programme (JMP) for Water Supply and Sanitation (http://www.wssinfo.org/).
Categorias:
Agriculture & Rural Development, Health
Foi atualizado:
23 abr 2017 ano
Indicadores de alterações dos valores ao longo dos anos
Mínimo:
39.594
1 jan 1991 ano
Máximo:
63.596
1 jan 2016 ano
Na data de observação
Valor
Mudança absoluta
A alteração em relação ao valor anterior
1 jan 1991 ano
39.594
+39.594
0.0%
1 jan 1992 ano
40.783
+1.188
3.0%
1 jan 1993 ano
41.711
+0.928
2.28%
1 jan 1994 ano
42.605
+0.895
2.14%
1 jan 1995 ano
43.475
+0.87
2.04%
1 jan 1996 ano
44.367
+0.892
2.05%
1 jan 1997 ano
45.398
+1.03
2.32%
1 jan 1998 ano
46.372
+0.974
2.14%
1 jan 1999 ano
47.349
+0.977
2.11%
1 jan 2000 ano
48.398
+1.048
2.21%
1 jan 2001 ano
49.374
+0.977
2.02%
1 jan 2002 ano
50.406
+1.031
2.09%
1 jan 2003 ano
51.371
+0.965
1.92%
1 jan 2004 ano
52.332
+0.961
1.87%
1 jan 2005 ano
53.367
+1.036
1.98%
1 jan 2006 ano
54.317
+0.949
1.78%
1 jan 2007 ano
55.341
+1.024
1.89%
1 jan 2008 ano
56.284
+0.943
1.7%
1 jan 2009 ano
57.216
+0.932
1.66%
1 jan 2010 ano
58.2
+0.984
1.72%
1 jan 2011 ano
59.142
+0.942
1.62%
1 jan 2012 ano
60.147
+1.005
1.7%
1 jan 2013 ano
61.074
+0.927
1.54%
1 jan 2014 ano
61.939
+0.865
1.42%
1 jan 2015 ano
62.87
+0.931
1.5%
1 jan 2016 ano
63.596
+0.726
1.15%
Classificação de países por estatísticas atuais por anos


Comentários: