29
/pt/
pt
AIzaSyAYiBZKx7MnpbEhh9jyipgxe19OcubqV5w
April 1, 2024
277694
Uruguay
URY
true
2
1
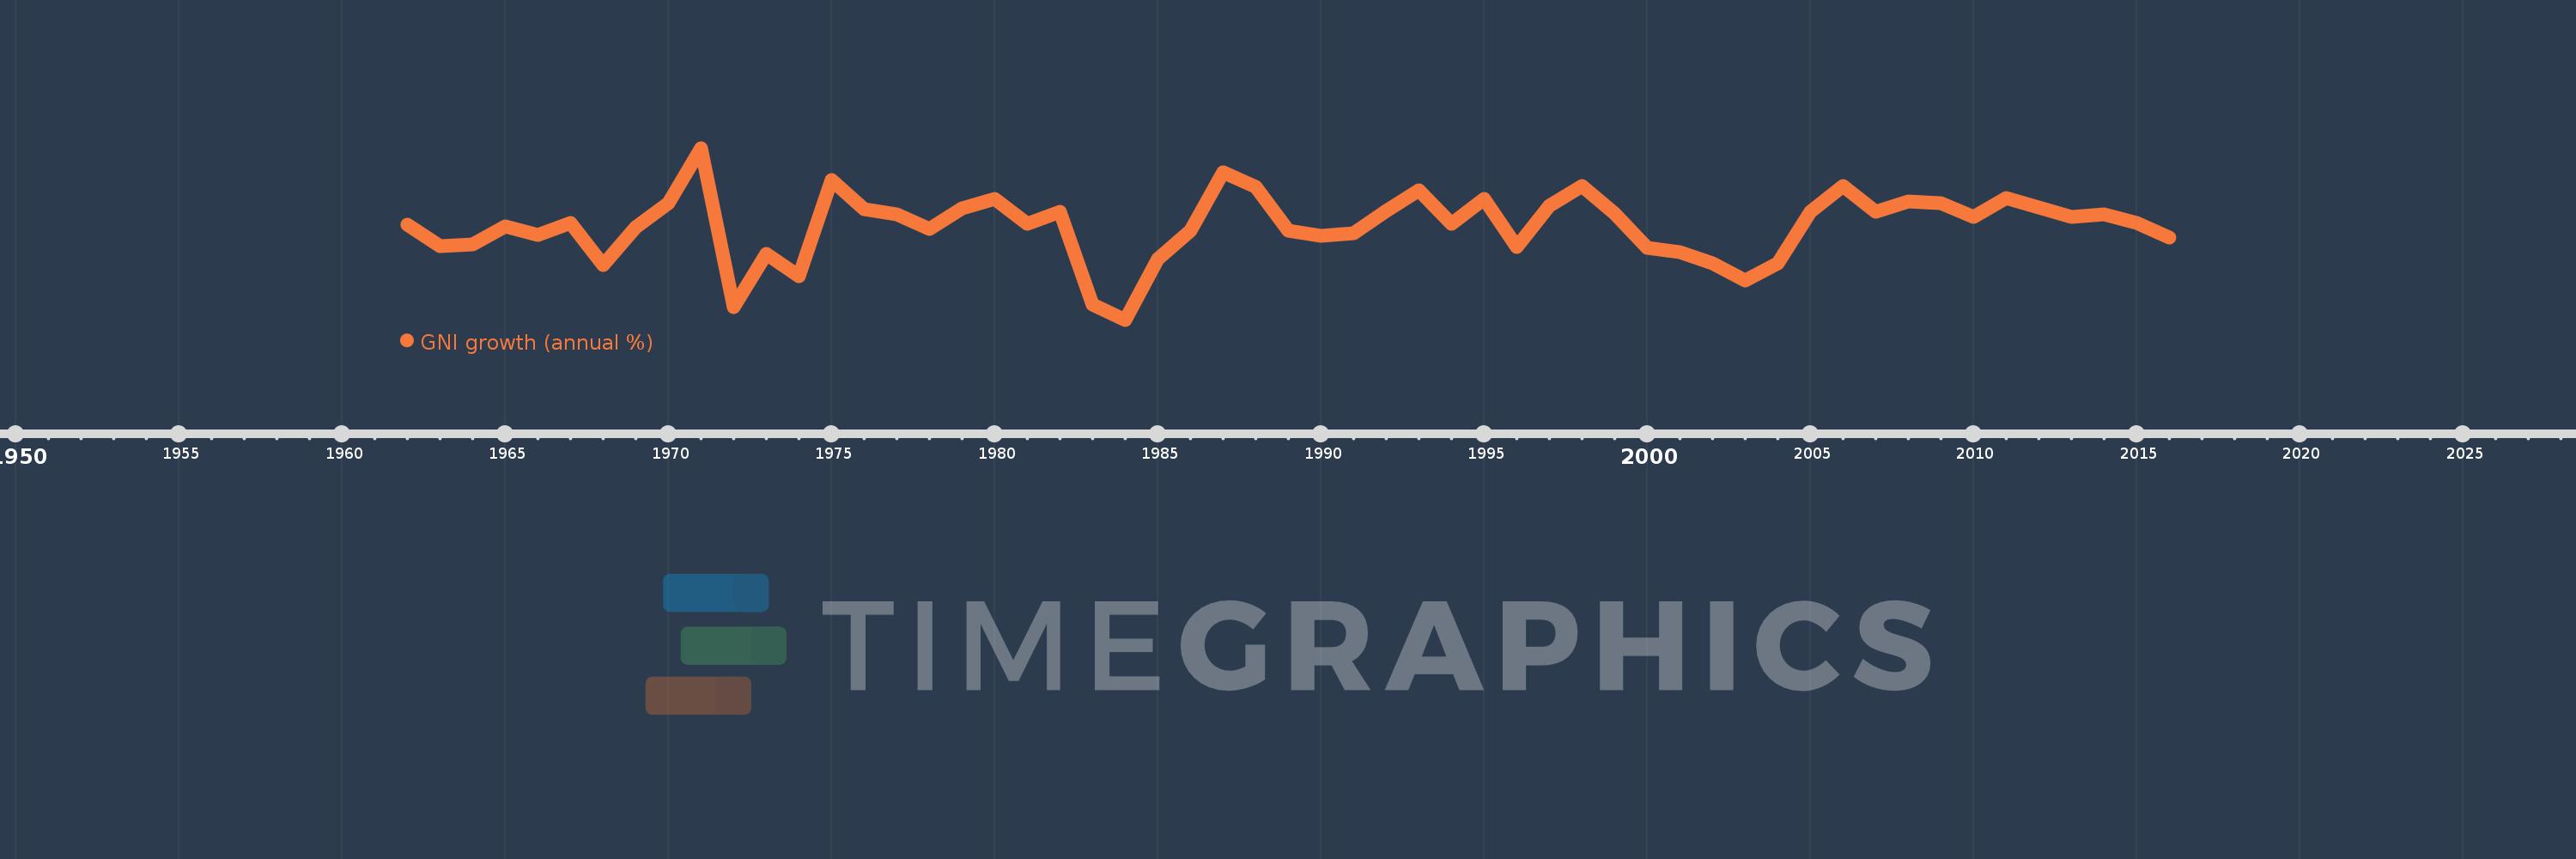
GNI growth (annual %)
2016,2015,2014,2013,2012,2011,2010,2009,2008,2007,2006,2005,2004,2003,2002,2001,2000,1999,1998,1997,1996,1995,1994,1993,1992,1991,1990,1989,1988,1987,1986,1985,1984,1983,1982,1981,1980,1979,1978,1977,1976,1975,1974,1973,1972,1971,1970,1969,1968,1967,1966,1965,1964,1963,1962
Estas estatísticas em outros países:
AlbaniaAlgeriaAngolaAntigua and BarbudaArab WorldArgentinaArmeniaAustraliaAustriaAzerbaijanBahamas, TheBahrainBangladeshBarbadosBelarusBelgiumBelizeBeninBhutanBoliviaBosnia and HerzegovinaBotswanaBrazilBrunei DarussalamBulgariaBurkina FasoBurundiCabo VerdeCambodiaCameroonCanadaCaribbean small statesCentral Europe and the BalticsChadChileChinaColombiaComorosCongo, Dem. Rep.Congo, Rep.Costa RicaCote d'IvoireCroatiaCubaCyprusCzech RepublicDenmarkDjiboutiDominican RepublicEarly-demographic dividendEast Asia & PacificEast Asia & Pacific (excluding high income)East Asia & Pacific (IDA & IBRD countries)EcuadorEgypt, Arab Rep.El SalvadorEquatorial GuineaEritreaEstoniaEthiopiaEuro areaEurope & Central AsiaEurope & Central Asia (excluding high income)Europe & Central Asia (IDA & IBRD countries)European UnionFijiFinlandFranceGabonGambia, TheGeorgiaGermanyGhanaGreeceGuatemalaGuineaGuinea-BissauHaitiHeavily indebted poor countries (HIPC)High incomeHondurasHong Kong SAR, ChinaHungaryIBRD onlyIcelandIDA & IBRD totalIDA blendIDA onlyIDA totalIndiaIndonesiaIran, Islamic Rep.IrelandIsraelItalyJamaicaJapanJordanKazakhstanKenyaKorea, Rep.KosovoKuwaitKyrgyz RepublicLao PDRLate-demographic dividendLatin America & Caribbean Latin America & Caribbean (excluding high income)Latin America & the Caribbean (IDA & IBRD countries)LatviaLeast developed countries: UN classificationLebanonLiberiaLibyaLithuaniaLow & middle incomeLow incomeLower middle incomeLuxembourgMacao SAR, ChinaMacedonia, FYRMadagascarMalawiMalaysiaMaliMaltaMauritaniaMauritiusMexicoMiddle East & North AfricaMiddle East & North Africa (excluding high income)Middle East & North Africa (IDA & IBRD countries)Middle incomeMoldovaMongoliaMontenegroMoroccoMozambiqueMyanmarNamibiaNepalNetherlandsNew ZealandNicaraguaNigerNigeriaNorth AmericaNorwayOECD membersOmanOther small statesPakistanPanamaPapua New GuineaParaguayPeruPhilippinesPolandPortugalPost-demographic dividendPre-demographic dividendPuerto RicoQatarRomaniaRussian FederationRwandaSamoaSaudi ArabiaSenegalSerbiaSeychellesSierra LeoneSingaporeSlovak RepublicSloveniaSmall statesSomaliaSouth AfricaSouth AsiaSouth Asia (IDA & IBRD)South SudanSpainSri LankaSub-Saharan Africa Sub-Saharan Africa (excluding high income)Sub-Saharan Africa (IDA & IBRD countries)SudanSurinameSwazilandSwedenSwitzerlandSyrian Arab RepublicTajikistanTanzaniaThailandTimor-LesteTogoTrinidad and TobagoTunisiaTurkeyTurkmenistanUgandaUkraineUnited Arab EmiratesUnited KingdomUnited StatesUpper middle incomeUruguayUzbekistanVanuatuVenezuela, RBVietnamWest Bank and GazaWorldZambiaZimbabwe Linha do tempo:
Nesta escala de tempo está apresentado um gráfico de 1962 ano até 2016 ano Uruguay. Dados de 1961 ano ausente. O número de observações reais por data: 55.
Fonte (nome):
Indicadores de desenvolvimento mundial
Fonte (organização):
World Bank national accounts data, and OECD National Accounts data files.
Categorias:
Economy & Growth
Foi atualizado:
23 abr 2017 ano
Indicadores de alterações dos valores ao longo dos anos
Mínimo:
-13.537
1 jan 1984 ano
Máximo:
15.674
1 jan 1971 ano
Na data de observação
Valor
Mudança absoluta
A alteração em relação ao valor anterior
1 jan 1962 ano
2.608
+2.608
0.0%
1 jan 1963 ano
-0.995
-3.603
-138.14%
1 jan 1964 ano
-0.715
+0.279
-28.08%
1 jan 1965 ano
2.389
+3.105
-434.01%
1 jan 1966 ano
0.814
-1.575
-65.92%
1 jan 1967 ano
2.901
+2.087
256.28%
1 jan 1968 ano
-4.19
-7.092
-244.41%
1 jan 1969 ano
2.161
+6.351
-151.58%
1 jan 1970 ano
6.325
+4.164
192.68%
1 jan 1971 ano
15.674
+9.348
147.8%
1 jan 1972 ano
-11.383
-27.057
-172.63%
1 jan 1973 ano
-2.382
+9.001
-79.07%
1 jan 1974 ano
-6.181
-3.799
159.47%
1 jan 1975 ano
10.248
+16.429
-265.79%
1 jan 1976 ano
5.219
-5.029
-49.07%
1 jan 1977 ano
4.326
-0.893
-17.11%
1 jan 1978 ano
1.862
-2.464
-56.96%
1 jan 1979 ano
5.451
+3.59
192.82%
1 jan 1980 ano
7.02
+1.569
28.79%
1 jan 1981 ano
2.737
-4.284
-61.02%
1 jan 1982 ano
4.773
+2.036
74.41%
1 jan 1983 ano
-11.013
-15.786
-330.74%
1 jan 1984 ano
-13.537
-2.524
22.92%
1 jan 1985 ano
-3.224
+10.313
-76.19%
1 jan 1986 ano
1.623
+4.847
-150.35%
1 jan 1987 ano
11.566
+9.943
612.62%
1 jan 1988 ano
9.007
-2.559
-22.13%
1 jan 1989 ano
1.554
-7.453
-82.75%
1 jan 1990 ano
0.675
-0.879
-56.59%
1 jan 1991 ano
1.196
+0.522
77.33%
1 jan 1992 ano
4.956
+3.76
314.33%
1 jan 1993 ano
8.539
+3.583
72.31%
1 jan 1994 ano
2.836
-5.703
-66.79%
1 jan 1995 ano
7.026
+4.19
147.73%
1 jan 1996 ano
-1.18
-8.205
-116.79%
1 jan 1997 ano
5.784
+6.964
-590.31%
1 jan 1998 ano
9.24
+3.456
59.75%
1 jan 1999 ano
4.475
-4.765
-51.57%
1 jan 2000 ano
-1.285
-5.759
-128.71%
1 jan 2001 ano
-2.03
-0.745
58.03%
1 jan 2002 ano
-3.882
-1.852
91.25%
1 jan 2003 ano
-6.888
-3.005
77.42%
1 jan 2004 ano
-4.004
+2.884
-41.87%
1 jan 2005 ano
4.778
+8.782
-219.35%
1 jan 2006 ano
9.201
+4.423
92.56%
1 jan 2007 ano
4.808
-4.393
-47.75%
1 jan 2008 ano
6.544
+1.736
36.12%
1 jan 2009 ano
6.3
-0.244
-3.74%
1 jan 2010 ano
3.888
-2.412
-38.29%
1 jan 2011 ano
7.203
+3.316
85.28%
1 jan 2012 ano
5.514
-1.689
-23.45%
1 jan 2013 ano
3.977
-1.537
-27.87%
1 jan 2014 ano
4.317
+0.34
8.55%
1 jan 2015 ano
2.922
-1.395
-32.31%
1 jan 2016 ano
0.513
-2.41
-82.46%
Classificação de países por estatísticas atuais por anos


Comentários: