29
/pt/
pt
AIzaSyAYiBZKx7MnpbEhh9jyipgxe19OcubqV5w
April 1, 2024
268221
Tunisia
TUN
true
2
1
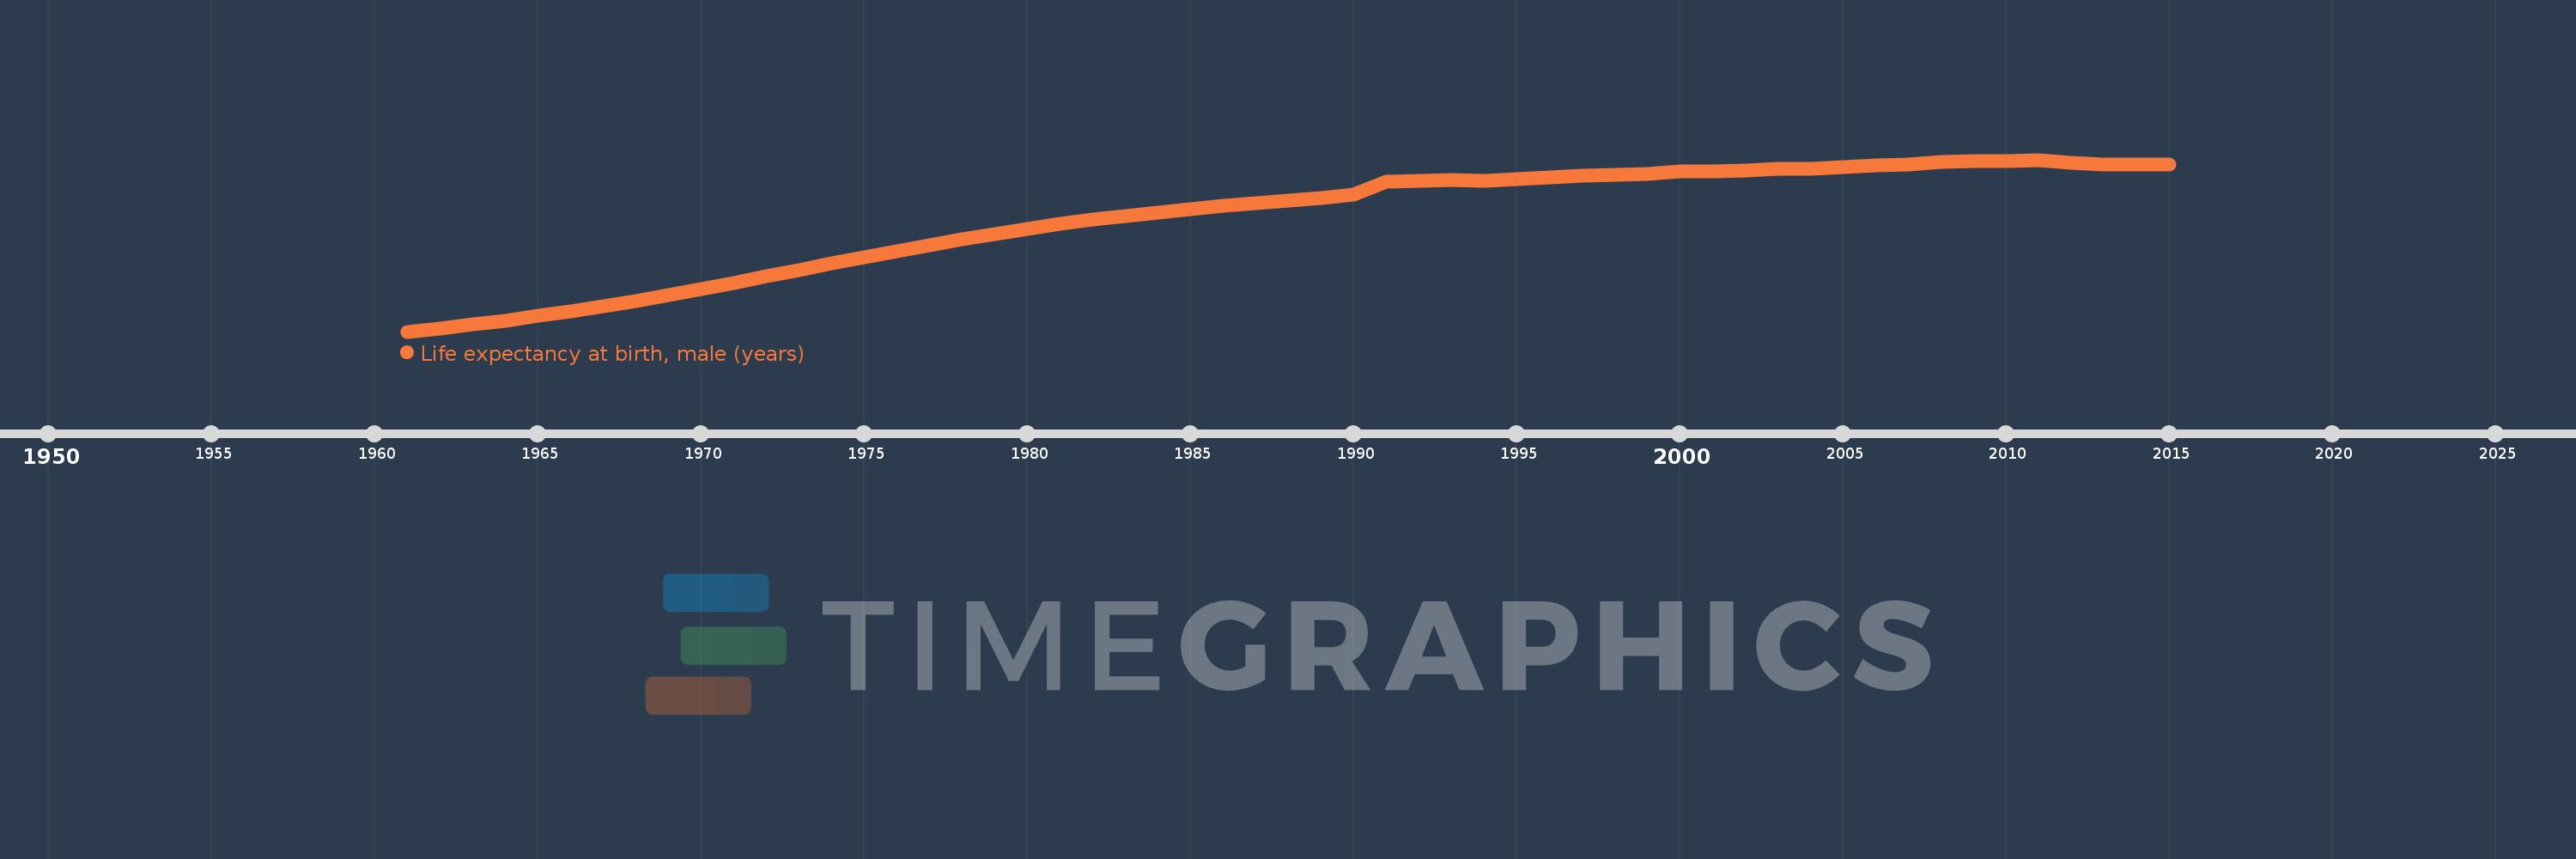
Life expectancy at birth, male (years)
2015,2014,2013,2012,2011,2010,2009,2008,2007,2006,2005,2004,2003,2002,2001,2000,1999,1998,1997,1996,1995,1994,1993,1992,1991,1990,1989,1988,1987,1986,1985,1984,1983,1982,1981,1980,1979,1978,1977,1976,1975,1974,1973,1972,1971,1970,1969,1968,1967,1966,1965,1964,1963,1962,1961
Estas estatísticas em outros países:
AfghanistanAlbaniaAlgeriaAngolaAntigua and BarbudaArab WorldArgentinaArmeniaArubaAustraliaAustriaAzerbaijanBahamas, TheBahrainBangladeshBarbadosBelarusBelgiumBelizeBeninBermudaBhutanBoliviaBosnia and HerzegovinaBotswanaBrazilBrunei DarussalamBulgariaBurkina FasoBurundiCabo VerdeCambodiaCameroonCanadaCaribbean small statesCentral African RepublicCentral Europe and the BalticsChadChannel IslandsChileChinaColombiaComorosCongo, Dem. Rep.Congo, Rep.Costa RicaCote d'IvoireCroatiaCubaCuracaoCyprusCzech RepublicDenmarkDjiboutiDominicaDominican RepublicEarly-demographic dividendEast Asia & PacificEast Asia & Pacific (excluding high income)East Asia & Pacific (IDA & IBRD countries)EcuadorEgypt, Arab Rep.El SalvadorEquatorial GuineaEritreaEstoniaEthiopiaEuro areaEurope & Central AsiaEurope & Central Asia (excluding high income)Europe & Central Asia (IDA & IBRD countries)European UnionFaroe IslandsFijiFinlandFragile and conflict affected situationsFranceFrench PolynesiaGabonGambia, TheGeorgiaGermanyGhanaGreeceGreenlandGrenadaGuamGuatemalaGuineaGuinea-BissauGuyanaHaitiHeavily indebted poor countries (HIPC)High incomeHondurasHong Kong SAR, ChinaHungaryIBRD onlyIcelandIDA & IBRD totalIDA blendIDA onlyIDA totalIndiaIndonesiaIran, Islamic Rep.IraqIrelandIsle of ManIsraelItalyJamaicaJapanJordanKazakhstanKenyaKiribatiKorea, Dem. People’s Rep.Korea, Rep.KosovoKuwaitKyrgyz RepublicLao PDRLate-demographic dividendLatin America & Caribbean Latin America & Caribbean (excluding high income)Latin America & the Caribbean (IDA & IBRD countries)LatviaLeast developed countries: UN classificationLebanonLesothoLiberiaLibyaLiechtensteinLithuaniaLow & middle incomeLow incomeLower middle incomeLuxembourgMacao SAR, ChinaMacedonia, FYRMadagascarMalawiMalaysiaMaldivesMaliMaltaMarshall IslandsMauritaniaMauritiusMexicoMicronesia, Fed. Sts.Middle East & North AfricaMiddle East & North Africa (excluding high income)Middle East & North Africa (IDA & IBRD countries)Middle incomeMoldovaMongoliaMontenegroMoroccoMozambiqueMyanmarNamibiaNepalNetherlandsNew CaledoniaNew ZealandNicaraguaNigerNigeriaNorth AmericaNorwayOECD membersOmanOther small statesPacific island small statesPakistanPalauPanamaPapua New GuineaParaguayPeruPhilippinesPolandPortugalPost-demographic dividendPre-demographic dividendPuerto RicoQatarRomaniaRussian FederationRwandaSamoaSan MarinoSao Tome and PrincipeSaudi ArabiaSenegalSerbiaSeychellesSierra LeoneSingaporeSint Maarten (Dutch part)Slovak RepublicSloveniaSmall statesSolomon IslandsSomaliaSouth AfricaSouth AsiaSouth Asia (IDA & IBRD)South SudanSpainSri LankaSt. Kitts and NevisSt. LuciaSt. Martin (French part)St. Vincent and the GrenadinesSub-Saharan Africa Sub-Saharan Africa (excluding high income)Sub-Saharan Africa (IDA & IBRD countries)SudanSurinameSwazilandSwedenSwitzerlandSyrian Arab RepublicTajikistanTanzaniaThailandTimor-LesteTogoTongaTrinidad and TobagoTunisiaTurkeyTurkmenistanUgandaUkraineUnited Arab EmiratesUnited KingdomUnited StatesUpper middle incomeUruguayUzbekistanVanuatuVenezuela, RBVietnamVirgin Islands (U.S.)West Bank and GazaWorldYemen, Rep.ZambiaZimbabwe Linha do tempo:
Nesta escala de tempo está apresentado um gráfico de 1961 ano até 2015 ano Tunisia. Dados de 1960 ano ausente. O número de observações reais por data: 55.
Fonte (nome):
Indicadores de desenvolvimento mundial
Fonte (organização):
(1) United Nations Population Division. World Population Prospects, (2) Census reports and other statistical publications from national statistical offices, (3) Eurostat: Demographic Statistics, (4) United Nations Statistical Division. Population and Vital Statistics Reprot (various years), (5) U.S. Census Bureau: International Database, and (6) Secretariat of the Pacific Community: Statistics and Demography Programme.
Categorias:
Health, Gender, Social Development
Foi atualizado:
23 abr 2017 ano
Indicadores de alterações dos valores ao longo dos anos
Mínimo:
41.06
1 jan 1961 ano
Máximo:
72.7
1 jan 2011 ano
Na data de observação
Valor
Mudança absoluta
A alteração em relação ao valor anterior
1 jan 1961 ano
41.06
+41.06
0.0%
1 jan 1962 ano
41.686
+0.626
1.52%
1 jan 1963 ano
42.369
+0.683
1.64%
1 jan 1964 ano
43.112
+0.743
1.75%
1 jan 1965 ano
43.918
+0.806
1.87%
1 jan 1966 ano
44.791
+0.873
1.99%
1 jan 1967 ano
45.733
+0.942
2.1%
1 jan 1968 ano
46.741
+1.008
2.2%
1 jan 1969 ano
47.804
+1.063
2.27%
1 jan 1970 ano
48.91
+1.106
2.31%
1 jan 1971 ano
50.052
+1.142
2.33%
1 jan 1972 ano
51.219
+1.167
2.33%
1 jan 1973 ano
52.4
+1.181
2.31%
1 jan 1974 ano
53.58
+1.18
2.25%
1 jan 1975 ano
54.743
+1.163
2.17%
1 jan 1976 ano
55.876
+1.133
2.07%
1 jan 1977 ano
56.972
+1.096
1.96%
1 jan 1978 ano
58.026
+1.054
1.85%
1 jan 1979 ano
59.032
+1.006
1.73%
1 jan 1980 ano
59.983
+0.951
1.61%
1 jan 1981 ano
60.865
+0.882
1.47%
1 jan 1982 ano
61.667
+0.802
1.32%
1 jan 1983 ano
62.39
+0.723
1.17%
1 jan 1984 ano
63.041
+0.651
1.04%
1 jan 1985 ano
63.631
+0.59
0.94%
1 jan 1986 ano
64.175
+0.544
0.85%
1 jan 1987 ano
64.694
+0.519
0.81%
1 jan 1988 ano
65.206
+0.512
0.79%
1 jan 1989 ano
65.724
+0.518
0.79%
1 jan 1990 ano
66.253
+0.529
0.8%
1 jan 1991 ano
68.6
+2.347
3.54%
1 jan 1992 ano
68.8
+0.2
0.29%
1 jan 1993 ano
69.0
+0.2
0.29%
1 jan 1994 ano
68.9
-0.1
-0.14%
1 jan 1995 ano
69.1
+0.2
0.29%
1 jan 1996 ano
69.5
+0.4
0.58%
1 jan 1997 ano
69.7
+0.2
0.29%
1 jan 1998 ano
70.0
+0.3
0.43%
1 jan 1999 ano
70.1
+0.1
0.14%
1 jan 2000 ano
70.5
+0.4
0.57%
1 jan 2001 ano
70.6
+0.1
0.14%
1 jan 2002 ano
70.8
+0.2
0.28%
1 jan 2003 ano
71.0
+0.2
0.28%
1 jan 2004 ano
71.1
+0.1
0.14%
1 jan 2005 ano
71.4
+0.3
0.42%
1 jan 2006 ano
71.6
+0.2
0.28%
1 jan 2007 ano
71.9
+0.3
0.42%
1 jan 2008 ano
72.3
+0.4
0.56%
1 jan 2009 ano
72.4
+0.1
0.14%
1 jan 2010 ano
72.5
+0.1
0.14%
1 jan 2011 ano
72.7
+0.2
0.28%
1 jan 2012 ano
72.1
-0.6
-0.83%
1 jan 2013 ano
71.8
-0.3
-0.42%
1 jan 2014 ano
71.8
0.0
0.0%
1 jan 2015 ano
71.9
+0.1
0.14%
Classificação de países por estatísticas atuais por anos


Comentários: