29
/pt/
pt
AIzaSyAYiBZKx7MnpbEhh9jyipgxe19OcubqV5w
April 1, 2024
266163
Tonga
TON
true
2
1
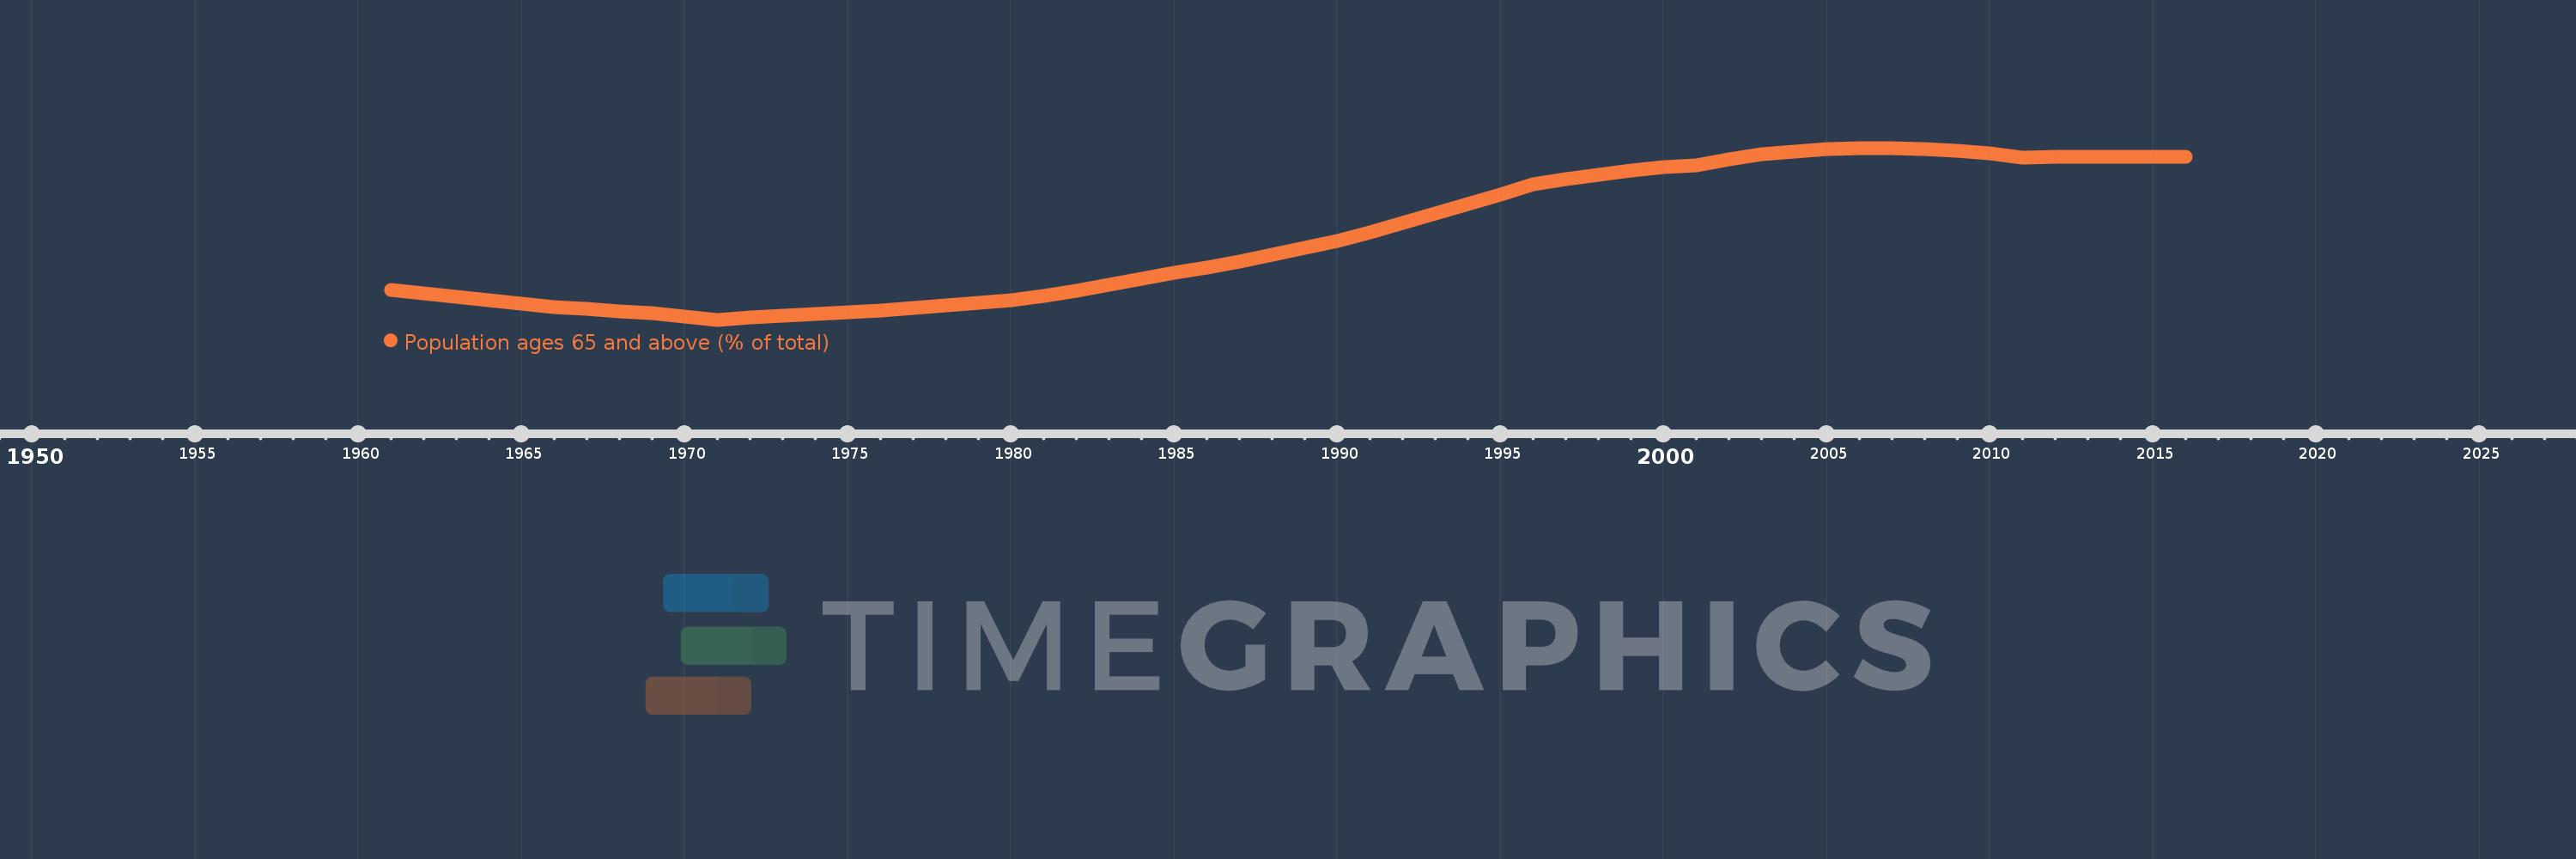
Population ages 65 and above (% of total)
2016,2015,2014,2013,2012,2011,2010,2009,2008,2007,2006,2005,2004,2003,2002,2001,2000,1999,1998,1997,1996,1995,1994,1993,1992,1991,1990,1989,1988,1987,1986,1985,1984,1983,1982,1981,1980,1979,1978,1977,1976,1975,1974,1973,1972,1971,1970,1969,1968,1967,1966,1965,1964,1963,1962,1961
Estas estatísticas em outros países:
AfghanistanAlbaniaAlgeriaAngolaAntigua and BarbudaArab WorldArgentinaArmeniaArubaAustraliaAustriaAzerbaijanBahamas, TheBahrainBangladeshBarbadosBelarusBelgiumBelizeBeninBhutanBoliviaBosnia and HerzegovinaBotswanaBrazilBrunei DarussalamBulgariaBurkina FasoBurundiCabo VerdeCambodiaCameroonCanadaCaribbean small statesCentral African RepublicCentral Europe and the BalticsChadChannel IslandsChileChinaColombiaComorosCongo, Dem. Rep.Congo, Rep.Costa RicaCote d'IvoireCroatiaCubaCuracaoCyprusCzech RepublicDenmarkDjiboutiDominican RepublicEarly-demographic dividendEast Asia & PacificEast Asia & Pacific (excluding high income)East Asia & Pacific (IDA & IBRD countries)EcuadorEgypt, Arab Rep.El SalvadorEquatorial GuineaEritreaEstoniaEthiopiaEuro areaEurope & Central AsiaEurope & Central Asia (excluding high income)Europe & Central Asia (IDA & IBRD countries)European UnionFijiFinlandFragile and conflict affected situationsFranceFrench PolynesiaGabonGambia, TheGeorgiaGermanyGhanaGreeceGrenadaGuamGuatemalaGuineaGuinea-BissauGuyanaHaitiHeavily indebted poor countries (HIPC)High incomeHondurasHong Kong SAR, ChinaHungaryIBRD onlyIcelandIDA & IBRD totalIDA blendIDA onlyIDA totalIndiaIndonesiaIran, Islamic Rep.IraqIrelandIsraelItalyJamaicaJapanJordanKazakhstanKenyaKiribatiKorea, Dem. People’s Rep.Korea, Rep.KosovoKuwaitKyrgyz RepublicLao PDRLate-demographic dividendLatin America & Caribbean Latin America & Caribbean (excluding high income)Latin America & the Caribbean (IDA & IBRD countries)LatviaLeast developed countries: UN classificationLebanonLesothoLiberiaLibyaLithuaniaLow & middle incomeLow incomeLower middle incomeLuxembourgMacao SAR, ChinaMacedonia, FYRMadagascarMalawiMalaysiaMaldivesMaliMaltaMauritaniaMauritiusMexicoMicronesia, Fed. Sts.Middle East & North AfricaMiddle East & North Africa (excluding high income)Middle East & North Africa (IDA & IBRD countries)Middle incomeMoldovaMongoliaMontenegroMoroccoMozambiqueMyanmarNamibiaNepalNetherlandsNew CaledoniaNew ZealandNicaraguaNigerNigeriaNorth AmericaNorwayOECD membersOmanOther small statesPacific island small statesPakistanPanamaPapua New GuineaParaguayPeruPhilippinesPolandPortugalPost-demographic dividendPre-demographic dividendPuerto RicoQatarRomaniaRussian FederationRwandaSamoaSao Tome and PrincipeSaudi ArabiaSenegalSerbiaSeychellesSierra LeoneSingaporeSlovak RepublicSloveniaSmall statesSolomon IslandsSomaliaSouth AfricaSouth AsiaSouth Asia (IDA & IBRD)South SudanSpainSri LankaSt. LuciaSt. Vincent and the GrenadinesSub-Saharan Africa Sub-Saharan Africa (excluding high income)Sub-Saharan Africa (IDA & IBRD countries)SudanSurinameSwazilandSwedenSwitzerlandSyrian Arab RepublicTajikistanTanzaniaThailandTimor-LesteTogoTongaTrinidad and TobagoTunisiaTurkeyTurkmenistanUgandaUkraineUnited Arab EmiratesUnited KingdomUnited StatesUpper middle incomeUruguayUzbekistanVanuatuVenezuela, RBVietnamVirgin Islands (U.S.)West Bank and GazaWorldYemen, Rep.ZambiaZimbabwe Linha do tempo:
Nesta escala de tempo está apresentado um gráfico de 1961 ano até 2016 ano Tonga. Dados de 1960 ano ausente. O número de observações reais por data: 56.
Fonte (nome):
Indicadores de desenvolvimento mundial
Fonte (organização):
World Bank staff estimates based on age distributions of United Nations Population Division's World Population Prospects.
Categorias:
Health
Foi atualizado:
23 abr 2017 ano
Indicadores de alterações dos valores ao longo dos anos
Mínimo:
2.86
1 jan 1971 ano
Máximo:
6.045
1 jan 2007 ano
Na data de observação
Valor
Mudança absoluta
A alteração em relação ao valor anterior
1 jan 1961 ano
3.416
+3.416
0.0%
1 jan 1962 ano
3.345
-0.071
-2.07%
1 jan 1963 ano
3.283
-0.062
-1.86%
1 jan 1964 ano
3.216
-0.067
-2.04%
1 jan 1965 ano
3.152
-0.064
-1.98%
1 jan 1966 ano
3.092
-0.061
-1.93%
1 jan 1967 ano
3.055
-0.036
-1.18%
1 jan 1968 ano
3.021
-0.034
-1.12%
1 jan 1969 ano
2.979
-0.042
-1.38%
1 jan 1970 ano
2.925
-0.054
-1.83%
1 jan 1971 ano
2.86
-0.065
-2.21%
1 jan 1972 ano
2.9
+0.04
1.39%
1 jan 1973 ano
2.939
+0.039
1.36%
1 jan 1974 ano
2.973
+0.034
1.15%
1 jan 1975 ano
3.004
+0.031
1.05%
1 jan 1976 ano
3.035
+0.03
1.01%
1 jan 1977 ano
3.081
+0.046
1.53%
1 jan 1978 ano
3.122
+0.041
1.33%
1 jan 1979 ano
3.169
+0.047
1.5%
1 jan 1980 ano
3.224
+0.056
1.75%
1 jan 1981 ano
3.298
+0.073
2.27%
1 jan 1982 ano
3.403
+0.105
3.19%
1 jan 1983 ano
3.514
+0.111
3.27%
1 jan 1984 ano
3.627
+0.113
3.21%
1 jan 1985 ano
3.73
+0.103
2.84%
1 jan 1986 ano
3.82
+0.09
2.42%
1 jan 1987 ano
3.933
+0.113
2.96%
1 jan 1988 ano
4.058
+0.125
3.18%
1 jan 1989 ano
4.19
+0.132
3.24%
1 jan 1990 ano
4.328
+0.138
3.29%
1 jan 1991 ano
4.475
+0.147
3.4%
1 jan 1992 ano
4.655
+0.18
4.01%
1 jan 1993 ano
4.831
+0.177
3.8%
1 jan 1994 ano
5.008
+0.177
3.65%
1 jan 1995 ano
5.187
+0.179
3.58%
1 jan 1996 ano
5.367
+0.179
3.46%
1 jan 1997 ano
5.461
+0.094
1.76%
1 jan 1998 ano
5.55
+0.089
1.63%
1 jan 1999 ano
5.634
+0.084
1.51%
1 jan 2000 ano
5.693
+0.06
1.06%
1 jan 2001 ano
5.729
+0.036
0.64%
1 jan 2002 ano
5.839
+0.11
1.92%
1 jan 2003 ano
5.923
+0.083
1.43%
1 jan 2004 ano
5.982
+0.059
0.99%
1 jan 2005 ano
6.021
+0.04
0.67%
1 jan 2006 ano
6.043
+0.022
0.36%
1 jan 2007 ano
6.045
+0.002
0.03%
1 jan 2008 ano
6.027
-0.018
-0.29%
1 jan 2009 ano
5.991
-0.036
-0.6%
1 jan 2010 ano
5.937
-0.054
-0.9%
1 jan 2011 ano
5.872
-0.065
-1.09%
1 jan 2012 ano
5.877
+0.005
0.08%
1 jan 2013 ano
5.882
+0.005
0.08%
1 jan 2014 ano
5.886
+0.005
0.08%
1 jan 2015 ano
5.884
-0.002
-0.04%
1 jan 2016 ano
5.874
-0.011
-0.18%
Classificação de países por estatísticas atuais por anos


Comentários: