29
/pt/
pt
AIzaSyAYiBZKx7MnpbEhh9jyipgxe19OcubqV5w
April 1, 2024
257395
Switzerland
CHE
true
2
1
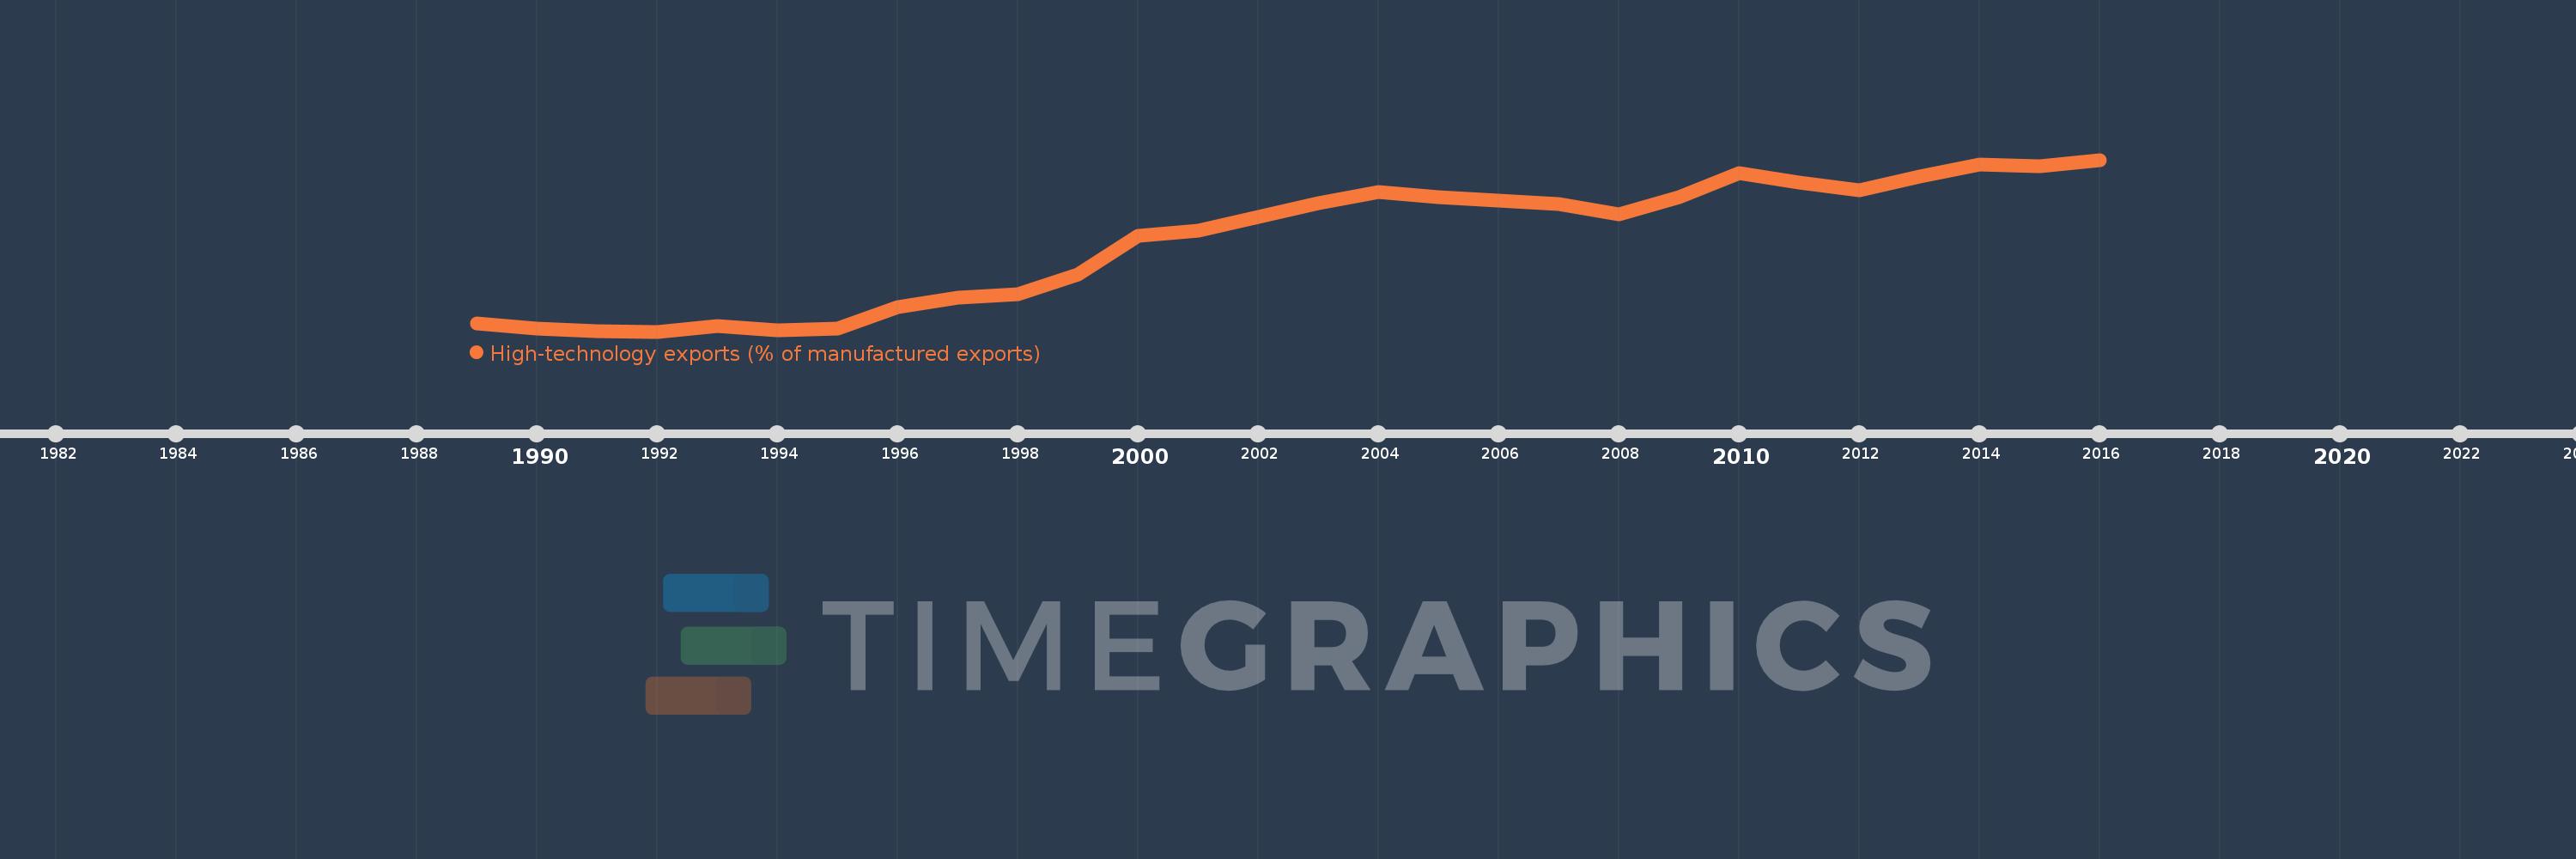
High-technology exports (% of manufactured exports)
2016,2015,2014,2013,2012,2011,2010,2009,2008,2007,2006,2005,2004,2003,2002,2001,2000,1999,1998,1997,1996,1995,1994,1993,1992,1991,1990,1989
Estas estatísticas em outros países:
AlbaniaAlgeriaAndorraAntigua and BarbudaArab WorldArgentinaArmeniaArubaAustraliaAustriaAzerbaijanBahamas, TheBahrainBangladeshBarbadosBelarusBelgiumBelizeBeninBermudaBhutanBoliviaBosnia and HerzegovinaBotswanaBrazilBrunei DarussalamBulgariaBurkina FasoBurundiCabo VerdeCambodiaCameroonCanadaCaribbean small statesCentral African RepublicCentral Europe and the BalticsChileChinaColombiaComorosCongo, Rep.Costa RicaCote d'IvoireCroatiaCubaCyprusCzech RepublicDenmarkDjiboutiDominicaDominican RepublicEarly-demographic dividendEast Asia & PacificEast Asia & Pacific (excluding high income)East Asia & Pacific (IDA & IBRD countries)EcuadorEgypt, Arab Rep.El SalvadorEritreaEstoniaEthiopiaEuro areaEurope & Central AsiaEurope & Central Asia (excluding high income)Europe & Central Asia (IDA & IBRD countries)European UnionFaroe IslandsFijiFinlandFragile and conflict affected situationsFranceFrench PolynesiaGabonGambia, TheGeorgiaGermanyGhanaGreeceGreenlandGrenadaGuatemalaGuineaGuinea-BissauGuyanaHaitiHeavily indebted poor countries (HIPC)High incomeHondurasHong Kong SAR, ChinaHungaryIBRD onlyIcelandIDA & IBRD totalIDA blendIDA onlyIDA totalIndiaIndonesiaIran, Islamic Rep.IraqIrelandIsraelItalyJamaicaJapanJordanKazakhstanKenyaKiribatiKorea, Rep.KuwaitKyrgyz RepublicLate-demographic dividendLatin America & Caribbean Latin America & Caribbean (excluding high income)Latin America & the Caribbean (IDA & IBRD countries)LatviaLebanonLesothoLithuaniaLow & middle incomeLow incomeLower middle incomeLuxembourgMacao SAR, ChinaMacedonia, FYRMadagascarMalawiMalaysiaMaldivesMaliMaltaMauritiusMexicoMiddle East & North AfricaMiddle East & North Africa (excluding high income)Middle East & North Africa (IDA & IBRD countries)Middle incomeMoldovaMongoliaMoroccoMozambiqueMyanmarNamibiaNepalNetherlandsNew CaledoniaNew ZealandNicaraguaNigerNigeriaNorth AmericaNorwayOECD membersOmanOther small statesPacific island small statesPakistanPalauPanamaPapua New GuineaParaguayPeruPhilippinesPolandPortugalPost-demographic dividendPre-demographic dividendQatarRomaniaRussian FederationRwandaSamoaSao Tome and PrincipeSaudi ArabiaSenegalSerbiaSeychellesSierra LeoneSingaporeSlovak RepublicSloveniaSmall statesSolomon IslandsSouth AfricaSouth AsiaSouth Asia (IDA & IBRD)SpainSri LankaSt. Kitts and NevisSt. LuciaSt. Vincent and the GrenadinesSub-Saharan Africa Sub-Saharan Africa (excluding high income)Sub-Saharan Africa (IDA & IBRD countries)SudanSurinameSwazilandSwedenSwitzerlandSyrian Arab RepublicTajikistanTanzaniaThailandTimor-LesteTogoTongaTrinidad and TobagoTunisiaTurkeyTurkmenistanTurks and Caicos IslandsTuvaluUgandaUkraineUnited Arab EmiratesUnited KingdomUnited StatesUpper middle incomeUruguayVanuatuVenezuela, RBVietnamWorldYemen, Rep.ZambiaZimbabwe Linha do tempo:
Nesta escala de tempo está apresentado um gráfico de 1989 ano até 2016 ano Switzerland. Dados de 1988 ano ausente. O número de observações reais por data: 28.
Fonte (nome):
Indicadores de desenvolvimento mundial
Fonte (organização):
United Nations, Comtrade database.
Categorias:
Private Sector, Science & Technology, Trade
Foi atualizado:
23 abr 2017 ano
Indicadores de alterações dos valores ao longo dos anos
Mínimo:
15.548
1 jan 1992 ano
Máximo:
26.838
1 jan 2016 ano
Na data de observação
Valor
Mudança absoluta
A alteração em relação ao valor anterior
1 jan 1989 ano
16.059
+16.059
0.0%
1 jan 1990 ano
15.772
-0.287
-1.79%
1 jan 1991 ano
15.577
-0.195
-1.24%
1 jan 1992 ano
15.548
-0.029
-0.19%
1 jan 1993 ano
15.929
+0.382
2.45%
1 jan 1994 ano
15.61
-0.319
-2.01%
1 jan 1995 ano
15.773
+0.163
1.04%
1 jan 1996 ano
17.141
+1.368
8.68%
1 jan 1997 ano
17.775
+0.634
3.7%
1 jan 1998 ano
18.013
+0.238
1.34%
1 jan 1999 ano
19.291
+1.279
7.1%
1 jan 2000 ano
21.831
+2.54
13.17%
1 jan 2001 ano
22.19
+0.358
1.64%
1 jan 2002 ano
23.059
+0.87
3.92%
1 jan 2003 ano
23.985
+0.925
4.01%
1 jan 2004 ano
24.745
+0.76
3.17%
1 jan 2005 ano
24.357
-0.388
-1.57%
1 jan 2006 ano
24.175
-0.182
-0.75%
1 jan 2007 ano
23.904
-0.271
-1.12%
1 jan 2008 ano
23.274
-0.63
-2.63%
1 jan 2009 ano
24.366
+1.092
4.69%
1 jan 2010 ano
25.984
+1.618
6.64%
1 jan 2011 ano
25.337
-0.647
-2.49%
1 jan 2012 ano
24.855
-0.482
-1.9%
1 jan 2013 ano
25.759
+0.904
3.64%
1 jan 2014 ano
26.514
+0.755
2.93%
1 jan 2015 ano
26.399
-0.115
-0.43%
1 jan 2016 ano
26.838
+0.439
1.66%
Classificação de países por estatísticas atuais por anos


Comentários: