29
/pt/
pt
AIzaSyAYiBZKx7MnpbEhh9jyipgxe19OcubqV5w
April 1, 2024
257271
Switzerland
CHE
true
2
1
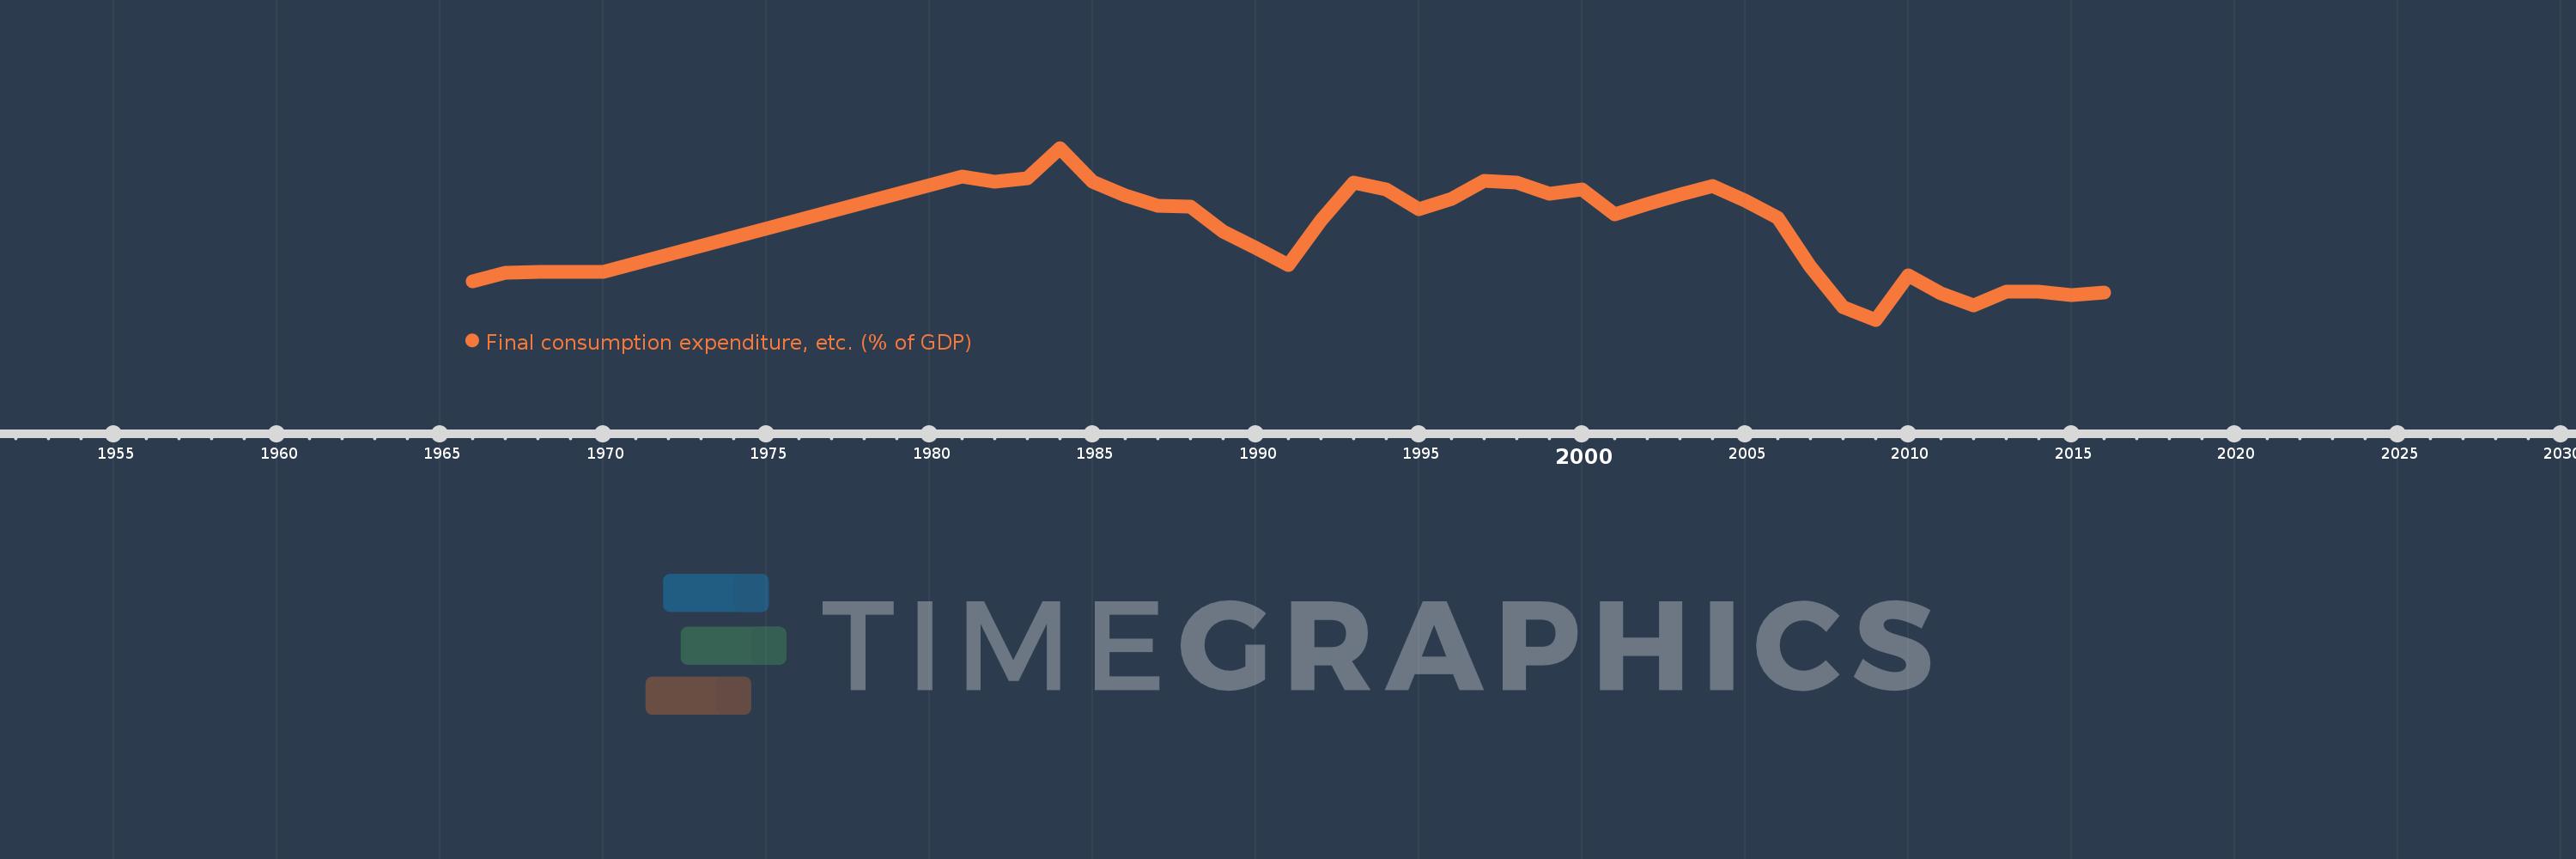
Final consumption expenditure, etc. (% of GDP)
2016,2015,2014,2013,2012,2011,2010,2009,2008,2007,2006,2005,2004,2003,2002,2001,2000,1999,1998,1997,1996,1995,1994,1993,1992,1991,1990,1989,1988,1987,1986,1985,1984,1983,1982,1981,1970,1969,1968,1967,1966
Estas estatísticas em outros países:
AfghanistanAlbaniaAlgeriaAngolaAntigua and BarbudaArgentinaArmeniaArubaAustraliaAustriaAzerbaijanBahamas, TheBahrainBangladeshBarbadosBelarusBelgiumBelizeBeninBermudaBhutanBoliviaBosnia and HerzegovinaBotswanaBrazilBrunei DarussalamBulgariaBurkina FasoBurundiCabo VerdeCambodiaCameroonCanadaCentral African RepublicChadChileChinaColombiaComorosCongo, Dem. Rep.Congo, Rep.Costa RicaCote d'IvoireCroatiaCubaCyprusCzech RepublicDenmarkDjiboutiDominicaDominican RepublicEcuadorEgypt, Arab Rep.El SalvadorEquatorial GuineaEritreaEstoniaEthiopiaFaroe IslandsFijiFinlandFranceGabonGambia, TheGeorgiaGermanyGhanaGreeceGrenadaGuatemalaGuineaGuinea-BissauGuyanaHaitiHondurasHong Kong SAR, ChinaHungaryIcelandIndiaIndonesiaIran, Islamic Rep.IraqIrelandIsraelItalyJamaicaJapanJordanKazakhstanKenyaKiribatiKorea, Rep.KosovoKuwaitKyrgyz RepublicLao PDRLatviaLebanonLesothoLiberiaLibyaLithuaniaLuxembourgMacao SAR, ChinaMacedonia, FYRMadagascarMalawiMalaysiaMaldivesMaliMaltaMauritaniaMauritiusMexicoMicronesia, Fed. Sts.MoldovaMongoliaMontenegroMoroccoMozambiqueNamibiaNepalNetherlandsNew CaledoniaNew ZealandNicaraguaNigerNigeriaNorwayOmanPakistanPanamaPapua New GuineaParaguayPeruPhilippinesPolandPortugalPuerto RicoQatarRomaniaRussian FederationRwandaSaudi ArabiaSenegalSerbiaSeychellesSierra LeoneSingaporeSlovak RepublicSloveniaSolomon IslandsSomaliaSouth AfricaSouth SudanSpainSri LankaSt. Kitts and NevisSt. LuciaSt. Vincent and the GrenadinesSudanSurinameSwazilandSwedenSwitzerlandSyrian Arab RepublicTajikistanTanzaniaThailandTimor-LesteTogoTongaTrinidad and TobagoTunisiaTurkeyTurkmenistanUgandaUkraineUnited Arab EmiratesUnited KingdomUnited StatesUruguayUzbekistanVanuatuVenezuela, RBVietnamWest Bank and GazaYemen, Rep.ZambiaZimbabwe Linha do tempo:
Nesta escala de tempo está apresentado um gráfico de 1966 ano até 2016 ano Switzerland. Dados de 1965 ano ausente. O número de observações reais por data: 41.
Fonte (nome):
Indicadores de desenvolvimento mundial
Fonte (organização):
World Bank national accounts data, and OECD National Accounts data files.
Categorias:
Economy & Growth
Foi atualizado:
23 abr 2017 ano
Indicadores de alterações dos valores ao longo dos anos
Mínimo:
63.987
1 jan 2009 ano
Máximo:
71.926
1 jan 1984 ano
Na data de observação
Valor
Mudança absoluta
A alteração em relação ao valor anterior
1 jan 1966 ano
65.748
+65.748
0.0%
1 jan 1967 ano
66.14
+0.392
0.6%
1 jan 1968 ano
66.19
+0.05
0.08%
1 jan 1969 ano
66.192
+0.003
0.0%
1 jan 1970 ano
66.198
+0.006
0.01%
1 jan 1981 ano
70.598
+4.399
6.65%
1 jan 1982 ano
70.367
-0.231
-0.33%
1 jan 1983 ano
70.543
+0.176
0.25%
1 jan 1984 ano
71.926
+1.383
1.96%
1 jan 1985 ano
70.378
-1.548
-2.15%
1 jan 1986 ano
69.73
-0.648
-0.92%
1 jan 1987 ano
69.271
-0.459
-0.66%
1 jan 1988 ano
69.196
-0.075
-0.11%
1 jan 1989 ano
68.052
-1.143
-1.65%
1 jan 1990 ano
67.298
-0.755
-1.11%
1 jan 1991 ano
66.525
-0.773
-1.15%
1 jan 1992 ano
68.579
+2.054
3.09%
1 jan 1993 ano
70.332
+1.753
2.56%
1 jan 1994 ano
69.991
-0.34
-0.48%
1 jan 1995 ano
69.099
-0.893
-1.28%
1 jan 1996 ano
69.581
+0.482
0.7%
1 jan 1997 ano
70.408
+0.826
1.19%
1 jan 1998 ano
70.341
-0.067
-0.09%
1 jan 1999 ano
69.812
-0.529
-0.75%
1 jan 2000 ano
70.027
+0.215
0.31%
1 jan 2001 ano
68.855
-1.172
-1.67%
1 jan 2002 ano
69.351
+0.496
0.72%
1 jan 2003 ano
69.779
+0.427
0.62%
1 jan 2004 ano
70.15
+0.371
0.53%
1 jan 2005 ano
69.506
-0.643
-0.92%
1 jan 2006 ano
68.701
-0.805
-1.16%
1 jan 2007 ano
66.455
-2.246
-3.27%
1 jan 2008 ano
64.573
-1.882
-2.83%
1 jan 2009 ano
63.987
-0.585
-0.91%
1 jan 2010 ano
66.052
+2.065
3.23%
1 jan 2011 ano
65.205
-0.847
-1.28%
1 jan 2012 ano
64.659
-0.546
-0.84%
1 jan 2013 ano
65.301
+0.642
0.99%
1 jan 2014 ano
65.303
+0.001
0.0%
1 jan 2015 ano
65.128
-0.174
-0.27%
1 jan 2016 ano
65.253
+0.125
0.19%
Classificação de países por estatísticas atuais por anos


Comentários: