29
/pt/
pt
AIzaSyAYiBZKx7MnpbEhh9jyipgxe19OcubqV5w
April 1, 2024
253765
Sudan
SDN
true
2
1
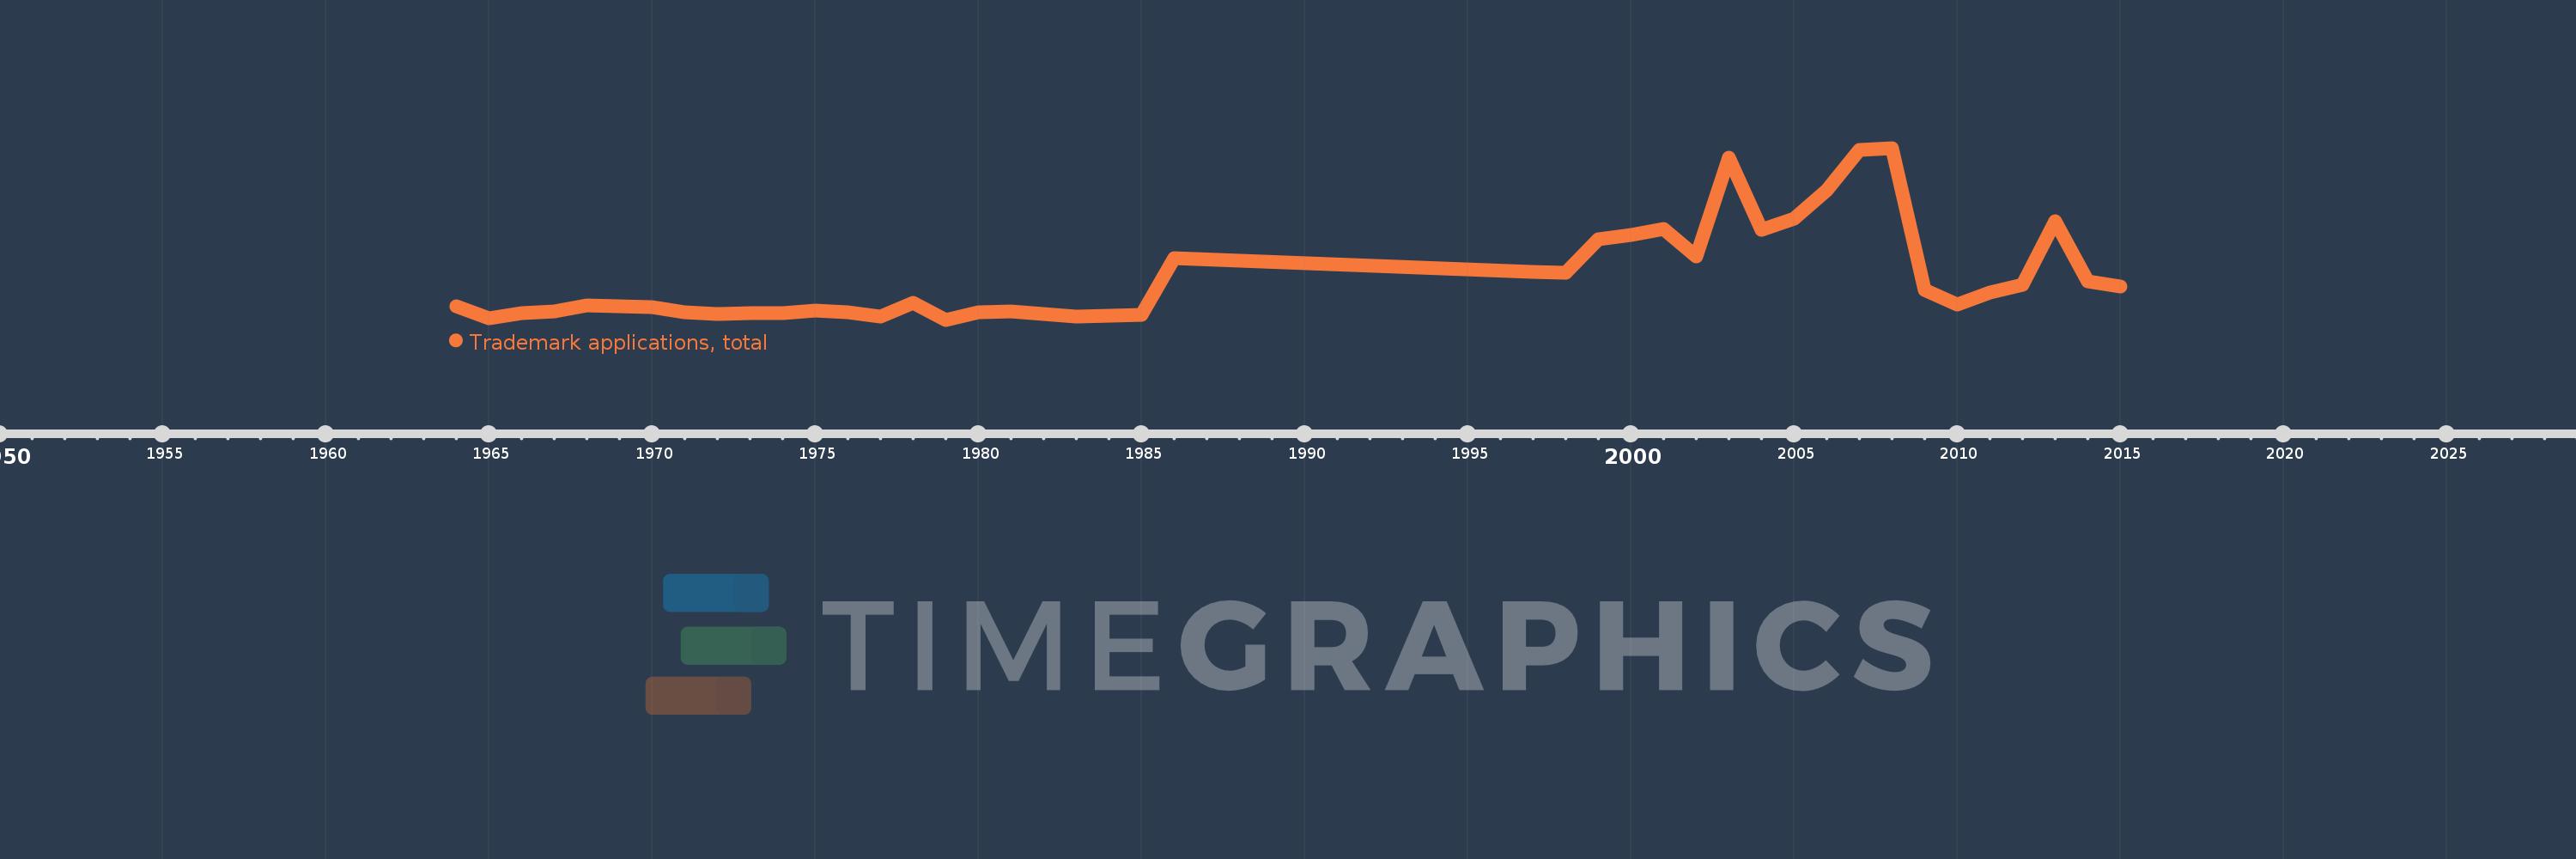
Trademark applications, total
2015,2014,2013,2012,2011,2010,2009,2008,2007,2006,2005,2004,2003,2002,2001,2000,1999,1998,1997,1986,1985,1983,1981,1980,1979,1978,1977,1976,1975,1974,1973,1972,1971,1970,1968,1967,1966,1965,1964
Estas estatísticas em outros países:
AlbaniaAlgeriaAndorraAngolaAntigua and BarbudaArab WorldArgentinaArmeniaArubaAustraliaAustriaAzerbaijanBahamas, TheBahrainBangladeshBarbadosBelarusBelgiumBelizeBhutanBoliviaBosnia and HerzegovinaBotswanaBrazilBrunei DarussalamBulgariaBurkina FasoBurundiCabo VerdeCambodiaCanadaCaribbean small statesCentral Europe and the BalticsChileChinaColombiaComorosCongo, Dem. Rep.Costa RicaCroatiaCubaCuracaoCyprusCzech RepublicDenmarkDjiboutiDominicaDominican RepublicEarly-demographic dividendEast Asia & PacificEast Asia & Pacific (excluding high income)East Asia & Pacific (IDA & IBRD countries)EcuadorEgypt, Arab Rep.El SalvadorEquatorial GuineaEstoniaEthiopiaEuro areaEurope & Central AsiaEurope & Central Asia (excluding high income)Europe & Central Asia (IDA & IBRD countries)European UnionFijiFinlandFranceGambia, TheGeorgiaGermanyGhanaGreeceGrenadaGuatemalaGuineaGuinea-BissauGuyanaHaitiHigh incomeHondurasHong Kong SAR, ChinaHungaryIBRD onlyIcelandIDA & IBRD totalIDA blendIDA onlyIDA totalIndiaIndonesiaIran, Islamic Rep.IraqIrelandIsraelItalyJamaicaJapanJordanKazakhstanKenyaKiribatiKorea, Dem. People’s Rep.Korea, Rep.KuwaitKyrgyz RepublicLao PDRLate-demographic dividendLatin America & Caribbean Latin America & Caribbean (excluding high income)Latin America & the Caribbean (IDA & IBRD countries)LatviaLeast developed countries: UN classificationLebanonLesothoLiberiaLibyaLiechtensteinLithuaniaLow & middle incomeLower middle incomeLuxembourgMacao SAR, ChinaMacedonia, FYRMadagascarMalawiMalaysiaMaldivesMaliMaltaMauritiusMexicoMiddle East & North AfricaMiddle East & North Africa (excluding high income)Middle East & North Africa (IDA & IBRD countries)Middle incomeMoldovaMonacoMongoliaMontenegroMoroccoMozambiqueMyanmarNamibiaNepalNetherlandsNew ZealandNicaraguaNigeriaNorth AmericaNorwayOECD membersOmanOther small statesPacific island small statesPakistanPanamaPapua New GuineaParaguayPeruPhilippinesPolandPortugalPost-demographic dividendQatarRomaniaRussian FederationRwandaSamoaSan MarinoSao Tome and PrincipeSaudi ArabiaSerbiaSeychellesSierra LeoneSingaporeSint Maarten (Dutch part)Slovak RepublicSloveniaSmall statesSolomon IslandsSomaliaSouth AfricaSouth AsiaSouth Asia (IDA & IBRD)SpainSri LankaSt. LuciaSt. Vincent and the GrenadinesSudanSurinameSwazilandSwedenSwitzerlandSyrian Arab RepublicTajikistanTanzaniaThailandTongaTrinidad and TobagoTunisiaTurkeyTurkmenistanTuvaluUgandaUkraineUnited Arab EmiratesUnited KingdomUnited StatesUpper middle incomeUruguayUzbekistanVenezuela, RBVietnamWorldYemen, Rep.ZambiaZimbabwe Linha do tempo:
Nesta escala de tempo está apresentado um gráfico de 1964 ano até 2015 ano Sudan. Dados de 1963 ano ausente. O número de observações reais por data: 39.
Fonte (nome):
Indicadores de desenvolvimento mundial
Fonte (organização):
World Intellectual Property Organization (WIPO), World Intellectual Property Indicators and www.wipo.int/econ_stat. The International Bureau of WIPO assumes no responsibility with respect to the transformation of these data.
Categorias:
Science & Technology
Foi atualizado:
23 abr 2017 ano
Indicadores de alterações dos valores ao longo dos anos
Mínimo:
394.0
1 jan 1979 ano
Máximo:
4.369 mil
1 jan 2008 ano
Na data de observação
Valor
Mudança absoluta
A alteração em relação ao valor anterior
1 jan 1964 ano
700.0
+700.0
0.0%
1 jan 1965 ano
432.0
-268.0
-38.29%
1 jan 1966 ano
543.0
+111.0
25.69%
1 jan 1967 ano
583.0
+40.0
7.37%
1 jan 1968 ano
732.0
+149.0
25.56%
1 jan 1970 ano
689.0
-43.0
-5.87%
1 jan 1971 ano
563.0
-126.0
-18.29%
1 jan 1972 ano
529.0
-34.0
-6.04%
1 jan 1973 ano
544.0
+15.0
2.84%
1 jan 1974 ano
543.0
-1.0
-0.18%
1 jan 1975 ano
609.0
+66.0
12.15%
1 jan 1976 ano
566.0
-43.0
-7.06%
1 jan 1977 ano
475.0
-91.0
-16.08%
1 jan 1978 ano
781.0
+306.0
64.42%
1 jan 1979 ano
394.0
-387.0
-49.55%
1 jan 1980 ano
571.0
+177.0
44.92%
1 jan 1981 ano
584.0
+13.0
2.28%
1 jan 1983 ano
462.0
-122.0
-20.89%
1 jan 1985 ano
505.0
+43.0
9.31%
1 jan 1986 ano
1.828 mil
+1.323 mil
261.98%
1 jan 1997 ano
1.508 mil
-320.0
-17.51%
1 jan 1998 ano
1.482 mil
-26.0
-1.72%
1 jan 1999 ano
2.252 mil
+770.0
51.96%
1 jan 2000 ano
2.353 mil
+101.0
4.48%
1 jan 2001 ano
2.485 mil
+132.0
5.61%
1 jan 2002 ano
1.868 mil
-617.0
-24.83%
1 jan 2003 ano
4.15 mil
+2.282 mil
122.16%
1 jan 2004 ano
2.469 mil
-1.681 mil
-40.51%
1 jan 2005 ano
2.733 mil
+264.0
10.69%
1 jan 2006 ano
3.389 mil
+656.0
24.0%
1 jan 2007 ano
4.318 mil
+929.0
27.41%
1 jan 2008 ano
4.369 mil
+51.0
1.18%
1 jan 2009 ano
1.075 mil
-3.294 mil
-75.39%
1 jan 2010 ano
743.0
-332.0
-30.88%
1 jan 2011 ano
1.025 mil
+282.0
37.95%
1 jan 2012 ano
1.198 mil
+173.0
16.88%
1 jan 2013 ano
2.676 mil
+1.478 mil
123.37%
1 jan 2014 ano
1.288 mil
-1.388 mil
-51.87%
1 jan 2015 ano
1.165 mil
-123.0
-9.55%
Classificação de países por estatísticas atuais por anos


Comentários: