29
/pt/
pt
AIzaSyAYiBZKx7MnpbEhh9jyipgxe19OcubqV5w
April 1, 2024
249028
Sri Lanka
LKA
true
2
1
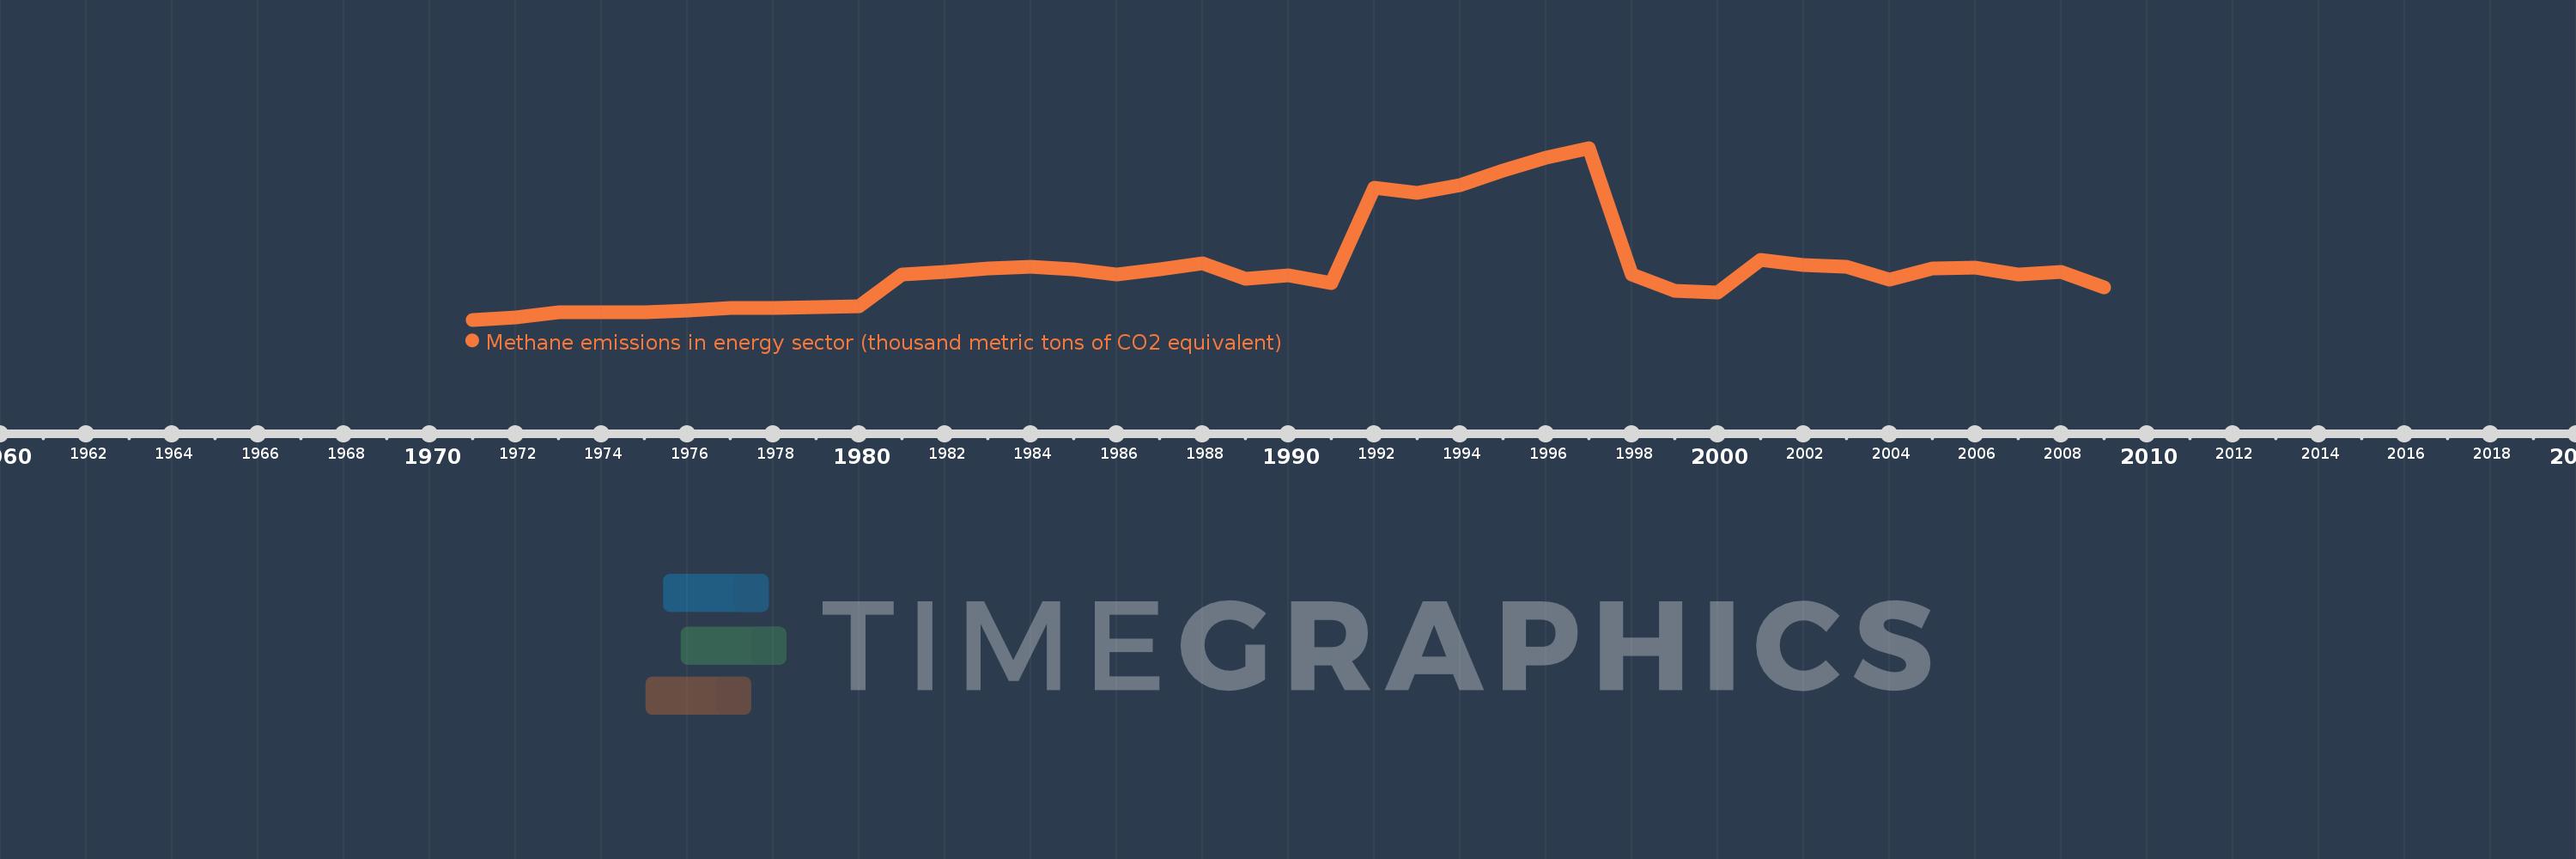
Methane emissions in energy sector (thousand metric tons of CO2 equivalent)
2009,2008,2007,2006,2005,2004,2003,2002,2001,2000,1999,1998,1997,1996,1995,1994,1993,1992,1991,1990,1989,1988,1987,1986,1985,1984,1983,1982,1981,1980,1979,1978,1977,1976,1975,1974,1973,1972,1971
Estas estatísticas em outros países:
AfghanistanAlbaniaAlgeriaAmerican SamoaAndorraAngolaAntigua and BarbudaArab WorldArgentinaArmeniaArubaAustraliaAustriaAzerbaijanBahamas, TheBahrainBangladeshBarbadosBelarusBelgiumBelizeBeninBermudaBhutanBoliviaBosnia and HerzegovinaBotswanaBrazilBritish Virgin IslandsBrunei DarussalamBulgariaBurkina FasoBurundiCabo VerdeCambodiaCameroonCanadaCaribbean small statesCayman IslandsCentral African RepublicCentral Europe and the BalticsChadChannel IslandsChileChinaColombiaComorosCongo, Dem. Rep.Congo, Rep.Costa RicaCote d'IvoireCroatiaCubaCuracaoCyprusCzech RepublicDenmarkDjiboutiDominicaDominican RepublicEarly-demographic dividendEast Asia & PacificEast Asia & Pacific (excluding high income)East Asia & Pacific (IDA & IBRD countries)EcuadorEgypt, Arab Rep.El SalvadorEquatorial GuineaEritreaEstoniaEthiopiaEuro areaEurope & Central AsiaEurope & Central Asia (excluding high income)Europe & Central Asia (IDA & IBRD countries)European UnionFaroe IslandsFijiFinlandFragile and conflict affected situationsFranceFrench PolynesiaGabonGambia, TheGeorgiaGermanyGhanaGibraltarGreeceGreenlandGrenadaGuamGuatemalaGuineaGuinea-BissauGuyanaHaitiHeavily indebted poor countries (HIPC)High incomeHondurasHong Kong SAR, ChinaHungaryIBRD onlyIcelandIDA & IBRD totalIDA blendIDA onlyIDA totalIndiaIndonesiaIran, Islamic Rep.IraqIrelandIsle of ManIsraelItalyJamaicaJapanJordanKazakhstanKenyaKiribatiKorea, Dem. People’s Rep.Korea, Rep.KosovoKuwaitKyrgyz RepublicLao PDRLate-demographic dividendLatin America & Caribbean Latin America & Caribbean (excluding high income)Latin America & the Caribbean (IDA & IBRD countries)LatviaLeast developed countries: UN classificationLebanonLesothoLiberiaLibyaLiechtensteinLithuaniaLow & middle incomeLow incomeLower middle incomeLuxembourgMacao SAR, ChinaMacedonia, FYRMadagascarMalawiMalaysiaMaldivesMaliMaltaMarshall IslandsMauritaniaMauritiusMexicoMicronesia, Fed. Sts.Middle East & North AfricaMiddle East & North Africa (excluding high income)Middle East & North Africa (IDA & IBRD countries)Middle incomeMoldovaMonacoMongoliaMontenegroMoroccoMozambiqueMyanmarNamibiaNauruNepalNetherlandsNew CaledoniaNew ZealandNicaraguaNigerNigeriaNorth AmericaNorthern Mariana IslandsNorwayOECD membersOmanOther small statesPacific island small statesPakistanPalauPanamaPapua New GuineaParaguayPeruPhilippinesPolandPortugalPost-demographic dividendPre-demographic dividendPuerto RicoQatarRomaniaRussian FederationRwandaSamoaSan MarinoSao Tome and PrincipeSaudi ArabiaSenegalSerbiaSeychellesSierra LeoneSingaporeSint Maarten (Dutch part)Slovak RepublicSloveniaSmall statesSolomon IslandsSomaliaSouth AfricaSouth AsiaSouth Asia (IDA & IBRD)South SudanSpainSri LankaSt. Kitts and NevisSt. LuciaSt. Martin (French part)St. Vincent and the GrenadinesSub-Saharan Africa Sub-Saharan Africa (excluding high income)Sub-Saharan Africa (IDA & IBRD countries)SudanSurinameSwazilandSwedenSwitzerlandSyrian Arab RepublicTajikistanTanzaniaThailandTimor-LesteTogoTongaTrinidad and TobagoTunisiaTurkeyTurkmenistanTurks and Caicos IslandsTuvaluUgandaUkraineUnited Arab EmiratesUnited KingdomUnited StatesUpper middle incomeUruguayUzbekistanVanuatuVenezuela, RBVietnamVirgin Islands (U.S.)West Bank and GazaWorldYemen, Rep.ZambiaZimbabwe Linha do tempo:
Nesta escala de tempo está apresentado um gráfico de 1971 ano até 2009 ano Sri Lanka. Dados de 1970 ano ausente. O número de observações reais por data: 39.
Fonte (nome):
Indicadores de desenvolvimento mundial
Fonte (organização):
European Commission, Joint Research Centre (JRC)/Netherlands Environmental Assessment Agency (PBL). Emission Database for Global Atmospheric Research (EDGAR): http://edgar.jrc.ec.europa.eu/
Categorias:
Energy & Mining, Environment
Foi atualizado:
23 abr 2017 ano
Indicadores de alterações dos valores ao longo dos anos
Mínimo:
513.766
1 jan 1971 ano
Máximo:
880.222
1 jan 1997 ano
Na data de observação
Valor
Mudança absoluta
A alteração em relação ao valor anterior
1 jan 1971 ano
513.766
+513.766
0.0%
1 jan 1972 ano
519.179
+5.413
1.05%
1 jan 1973 ano
530.116
+10.938
2.11%
1 jan 1974 ano
528.9
-1.216
-0.23%
1 jan 1975 ano
530.02
+1.12
0.21%
1 jan 1976 ano
533.068
+3.048
0.58%
1 jan 1977 ano
538.987
+5.919
1.11%
1 jan 1978 ano
538.421
-0.566
-0.1%
1 jan 1979 ano
540.352
+1.931
0.36%
1 jan 1980 ano
543.209
+2.858
0.53%
1 jan 1981 ano
610.854
+67.645
12.45%
1 jan 1982 ano
616.08
+5.225
0.86%
1 jan 1983 ano
622.993
+6.913
1.12%
1 jan 1984 ano
626.797
+3.804
0.61%
1 jan 1985 ano
620.44
-6.357
-1.01%
1 jan 1986 ano
610.879
-9.561
-1.54%
1 jan 1987 ano
621.682
+10.803
1.77%
1 jan 1988 ano
633.413
+11.731
1.89%
1 jan 1989 ano
601.118
-32.295
-5.1%
1 jan 1990 ano
608.133
+7.015
1.17%
1 jan 1991 ano
591.843
-16.29
-2.68%
1 jan 1992 ano
794.728
+202.885
34.28%
1 jan 1993 ano
783.614
-11.115
-1.4%
1 jan 1994 ano
801.287
+17.673
2.26%
1 jan 1995 ano
832.131
+30.844
3.85%
1 jan 1996 ano
858.826
+26.695
3.21%
1 jan 1997 ano
880.222
+21.397
2.49%
1 jan 1998 ano
610.163
-270.059
-30.68%
1 jan 1999 ano
576.386
-33.777
-5.54%
1 jan 2000 ano
571.631
-4.756
-0.83%
1 jan 2001 ano
641.147
+69.516
12.16%
1 jan 2002 ano
629.941
-11.205
-1.75%
1 jan 2003 ano
625.909
-4.032
-0.64%
1 jan 2004 ano
599.404
-26.505
-4.23%
1 jan 2005 ano
623.801
+24.397
4.07%
1 jan 2006 ano
624.883
+1.082
0.17%
1 jan 2007 ano
610.414
-14.469
-2.32%
1 jan 2008 ano
616.091
+5.677
0.93%
1 jan 2009 ano
583.083
-33.008
-5.36%
Classificação de países por estatísticas atuais por anos


Comentários: