29
/pt/
pt
AIzaSyAYiBZKx7MnpbEhh9jyipgxe19OcubqV5w
April 1, 2024
248033
Spain
ESP
true
2
1
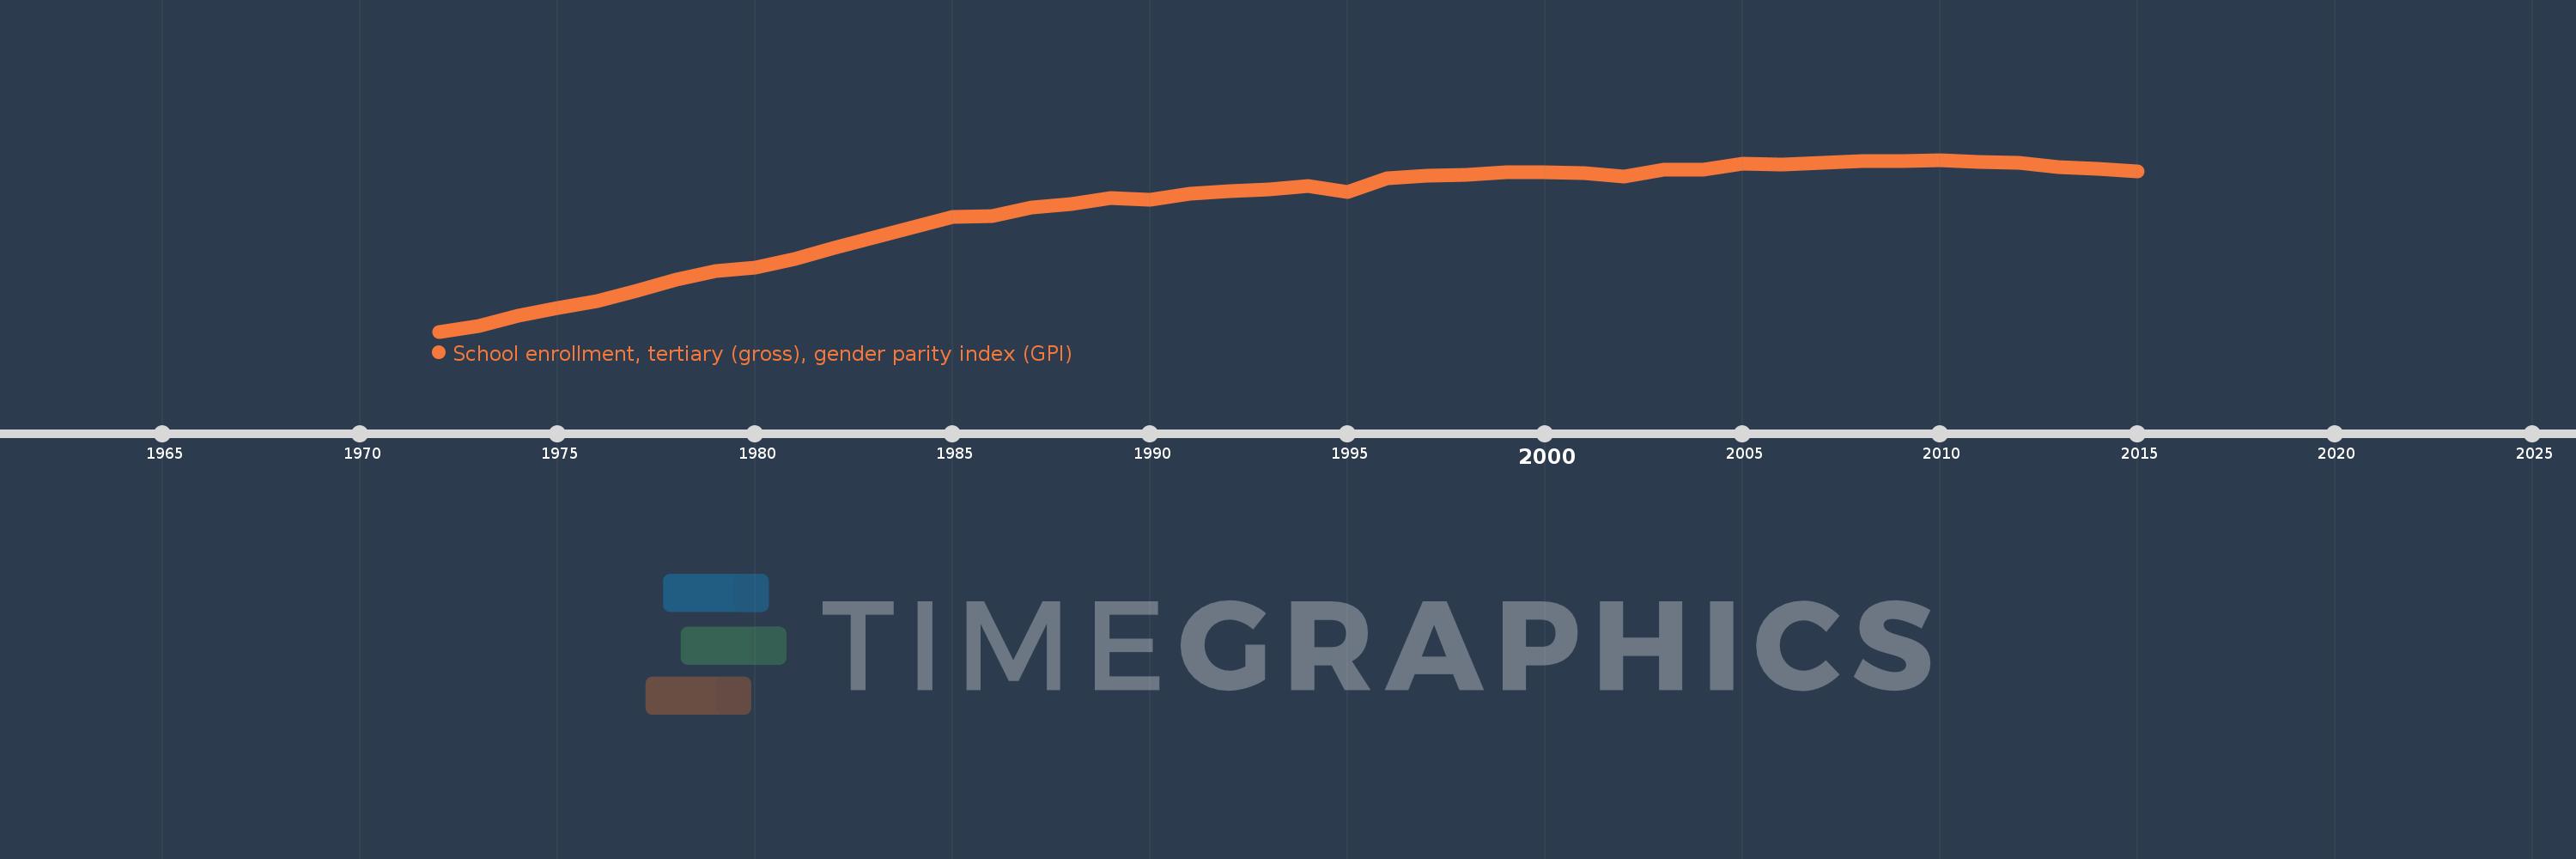
School enrollment, tertiary (gross), gender parity index (GPI)
2015,2014,2013,2012,2011,2010,2009,2008,2007,2006,2005,2004,2003,2002,2001,2000,1999,1998,1997,1996,1995,1994,1993,1992,1991,1990,1989,1988,1987,1986,1985,1984,1983,1982,1981,1980,1979,1978,1977,1976,1975,1974,1973,1972
Estas estatísticas em outros países:
AfghanistanAlbaniaAlgeriaAngolaAntigua and BarbudaArab WorldArgentinaArmeniaArubaAustraliaAustriaAzerbaijanBahamas, TheBahrainBangladeshBarbadosBelarusBelgiumBelizeBeninBermudaBhutanBoliviaBosnia and HerzegovinaBotswanaBrazilBrunei DarussalamBulgariaBurkina FasoBurundiCabo VerdeCambodiaCameroonCanadaCaribbean small statesCentral African RepublicCentral Europe and the BalticsChadChileChinaColombiaComorosCongo, Dem. Rep.Congo, Rep.Costa RicaCote d'IvoireCroatiaCubaCuracaoCyprusCzech RepublicDenmarkDjiboutiDominicaDominican RepublicEarly-demographic dividendEast Asia & PacificEast Asia & Pacific (excluding high income)East Asia & Pacific (IDA & IBRD countries)EcuadorEgypt, Arab Rep.El SalvadorEquatorial GuineaEritreaEstoniaEthiopiaEuro areaEurope & Central AsiaEurope & Central Asia (excluding high income)Europe & Central Asia (IDA & IBRD countries)European UnionFijiFinlandFragile and conflict affected situationsFranceGabonGambia, TheGeorgiaGermanyGhanaGreeceGrenadaGuatemalaGuineaGuinea-BissauGuyanaHaitiHeavily indebted poor countries (HIPC)High incomeHondurasHong Kong SAR, ChinaHungaryIBRD onlyIcelandIDA & IBRD totalIDA blendIDA onlyIDA totalIndiaIndonesiaIran, Islamic Rep.IraqIrelandIsraelItalyJamaicaJapanJordanKazakhstanKenyaKorea, Dem. People’s Rep.Korea, Rep.KuwaitKyrgyz RepublicLao PDRLate-demographic dividendLatin America & Caribbean Latin America & Caribbean (excluding high income)Latin America & the Caribbean (IDA & IBRD countries)LatviaLeast developed countries: UN classificationLebanonLesothoLiberiaLibyaLiechtensteinLithuaniaLow & middle incomeLow incomeLower middle incomeLuxembourgMacao SAR, ChinaMacedonia, FYRMadagascarMalawiMaldivesMaliMaltaMarshall IslandsMauritaniaMauritiusMexicoMicronesia, Fed. Sts.Middle East & North AfricaMiddle East & North Africa (excluding high income)Middle East & North Africa (IDA & IBRD countries)Middle incomeMoldovaMongoliaMontenegroMoroccoMozambiqueMyanmarNamibiaNepalNetherlandsNew ZealandNicaraguaNigerNigeriaNorth AmericaNorwayOECD membersOmanOther small statesPacific island small statesPakistanPalauPanamaPapua New GuineaParaguayPeruPhilippinesPolandPortugalPost-demographic dividendPre-demographic dividendPuerto RicoQatarRomaniaRussian FederationRwandaSamoaSan MarinoSao Tome and PrincipeSaudi ArabiaSenegalSerbiaSeychellesSierra LeoneSingaporeSlovak RepublicSloveniaSmall statesSomaliaSouth AfricaSouth AsiaSouth Asia (IDA & IBRD)SpainSri LankaSt. Kitts and NevisSt. LuciaSt. Vincent and the GrenadinesSub-Saharan Africa Sub-Saharan Africa (excluding high income)Sub-Saharan Africa (IDA & IBRD countries)SudanSurinameSwazilandSwedenSwitzerlandSyrian Arab RepublicTajikistanTanzaniaThailandTimor-LesteTogoTongaTrinidad and TobagoTunisiaTurkeyTurkmenistanUgandaUkraineUnited Arab EmiratesUnited KingdomUnited StatesUpper middle incomeUruguayUzbekistanVanuatuVenezuela, RBVietnamWest Bank and GazaWorldYemen, Rep.ZambiaZimbabwe Linha do tempo:
Nesta escala de tempo está apresentado um gráfico de 1972 ano até 2015 ano Spain. Dados de 1971 ano ausente. O número de observações reais por data: 44.
Fonte (nome):
Indicadores de desenvolvimento mundial
Fonte (organização):
United Nations Educational, Scientific, and Cultural Organization (UNESCO) Institute for Statistics.
Categorias:
Education, Gender, Social Development
Foi atualizado:
23 abr 2017 ano
Indicadores de alterações dos valores ao longo dos anos
Mínimo:
0.373
1 jan 1972 ano
Máximo:
1.25
1 jan 2010 ano
Na data de observação
Valor
Mudança absoluta
A alteração em relação ao valor anterior
1 jan 1972 ano
0.373
+0.373
0.0%
1 jan 1973 ano
0.401
+0.028
7.46%
1 jan 1974 ano
0.455
+0.054
13.51%
1 jan 1975 ano
0.492
+0.037
8.07%
1 jan 1976 ano
0.53
+0.038
7.7%
1 jan 1977 ano
0.583
+0.053
10.03%
1 jan 1978 ano
0.639
+0.055
9.49%
1 jan 1979 ano
0.683
+0.044
6.92%
1 jan 1980 ano
0.7
+0.017
2.48%
1 jan 1981 ano
0.743
+0.044
6.23%
1 jan 1982 ano
0.801
+0.058
7.77%
1 jan 1983 ano
0.852
+0.051
6.32%
1 jan 1984 ano
0.906
+0.054
6.31%
1 jan 1985 ano
0.958
+0.053
5.83%
1 jan 1986 ano
0.963
+0.004
0.45%
1 jan 1987 ano
1.006
+0.043
4.51%
1 jan 1988 ano
1.023
+0.017
1.66%
1 jan 1989 ano
1.053
+0.03
2.97%
1 jan 1990 ano
1.044
-0.009
-0.9%
1 jan 1991 ano
1.075
+0.031
2.99%
1 jan 1992 ano
1.089
+0.014
1.35%
1 jan 1993 ano
1.097
+0.008
0.75%
1 jan 1994 ano
1.118
+0.02
1.85%
1 jan 1995 ano
1.087
-0.031
-2.75%
1 jan 1996 ano
1.156
+0.069
6.35%
1 jan 1997 ano
1.17
+0.014
1.24%
1 jan 1998 ano
1.174
+0.004
0.33%
1 jan 1999 ano
1.185
+0.011
0.95%
1 jan 2000 ano
1.186
+0.001
0.07%
1 jan 2001 ano
1.184
-0.002
-0.18%
1 jan 2002 ano
1.165
-0.019
-1.6%
1 jan 2003 ano
1.198
+0.033
2.86%
1 jan 2004 ano
1.199
+0.0
0.02%
1 jan 2005 ano
1.232
+0.034
2.81%
1 jan 2006 ano
1.228
-0.005
-0.38%
1 jan 2007 ano
1.235
+0.007
0.57%
1 jan 2008 ano
1.244
+0.01
0.78%
1 jan 2009 ano
1.245
+0.001
0.09%
1 jan 2010 ano
1.25
+0.004
0.34%
1 jan 2011 ano
1.24
-0.01
-0.81%
1 jan 2012 ano
1.235
-0.005
-0.39%
1 jan 2013 ano
1.214
-0.021
-1.69%
1 jan 2014 ano
1.204
-0.01
-0.83%
1 jan 2015 ano
1.189
-0.015
-1.23%
Classificação de países por estatísticas atuais por anos


Comentários: