29
/pt/
pt
AIzaSyAYiBZKx7MnpbEhh9jyipgxe19OcubqV5w
April 1, 2024
240477
Singapore
SGP
true
2
1
GNI per capita growth (annual %)
2016,2015,2014,2013,2012,2011,2010,2009,2008,2007,2006,2005,2004,2003,2002,2001,2000,1999,1998,1997,1996,1995,1994,1993,1992,1991,1990,1989,1988,1987,1986,1985,1984,1983,1982,1981,1980,1979,1978,1977
Estas estatísticas em outros países:
AlbaniaAlgeriaAngolaAntigua and BarbudaArab WorldArgentinaArmeniaAustraliaAustriaAzerbaijanBahamas, TheBahrainBangladeshBarbadosBelarusBelgiumBelizeBeninBhutanBoliviaBosnia and HerzegovinaBotswanaBrazilBrunei DarussalamBulgariaBurkina FasoBurundiCabo VerdeCambodiaCameroonCanadaCaribbean small statesCentral Europe and the BalticsChadChileChinaColombiaComorosCongo, Dem. Rep.Congo, Rep.Costa RicaCote d'IvoireCroatiaCubaCyprusCzech RepublicDenmarkDjiboutiDominican RepublicEarly-demographic dividendEast Asia & PacificEast Asia & Pacific (excluding high income)East Asia & Pacific (IDA & IBRD countries)EcuadorEgypt, Arab Rep.El SalvadorEquatorial GuineaEritreaEstoniaEthiopiaEuro areaEurope & Central AsiaEurope & Central Asia (excluding high income)Europe & Central Asia (IDA & IBRD countries)European UnionFijiFinlandFranceGabonGambia, TheGeorgiaGermanyGhanaGreeceGuatemalaGuineaGuinea-BissauHaitiHeavily indebted poor countries (HIPC)High incomeHondurasHong Kong SAR, ChinaHungaryIBRD onlyIcelandIDA & IBRD totalIDA blendIDA onlyIDA totalIndiaIndonesiaIran, Islamic Rep.IrelandIsraelItalyJamaicaJapanJordanKazakhstanKenyaKorea, Rep.KosovoKuwaitKyrgyz RepublicLao PDRLate-demographic dividendLatin America & Caribbean Latin America & Caribbean (excluding high income)Latin America & the Caribbean (IDA & IBRD countries)LatviaLeast developed countries: UN classificationLebanonLiberiaLibyaLithuaniaLow & middle incomeLow incomeLower middle incomeLuxembourgMacao SAR, ChinaMacedonia, FYRMadagascarMalawiMalaysiaMaliMaltaMauritaniaMauritiusMexicoMiddle East & North AfricaMiddle East & North Africa (excluding high income)Middle East & North Africa (IDA & IBRD countries)Middle incomeMoldovaMongoliaMontenegroMoroccoMozambiqueMyanmarNamibiaNepalNetherlandsNew ZealandNicaraguaNigerNigeriaNorth AmericaNorwayOECD membersOmanOther small statesPakistanPanamaPapua New GuineaParaguayPeruPhilippinesPolandPortugalPost-demographic dividendPre-demographic dividendPuerto RicoQatarRomaniaRussian FederationRwandaSamoaSaudi ArabiaSenegalSerbiaSeychellesSierra LeoneSingaporeSlovak RepublicSloveniaSmall statesSomaliaSouth AfricaSouth AsiaSouth Asia (IDA & IBRD)South SudanSpainSri LankaSub-Saharan Africa Sub-Saharan Africa (excluding high income)Sub-Saharan Africa (IDA & IBRD countries)SudanSurinameSwazilandSwedenSwitzerlandSyrian Arab RepublicTajikistanTanzaniaThailandTimor-LesteTogoTrinidad and TobagoTunisiaTurkeyTurkmenistanUgandaUkraineUnited Arab EmiratesUnited KingdomUnited StatesUpper middle incomeUruguayUzbekistanVanuatuVenezuela, RBVietnamWest Bank and GazaWorldZambiaZimbabwe Linha do tempo:
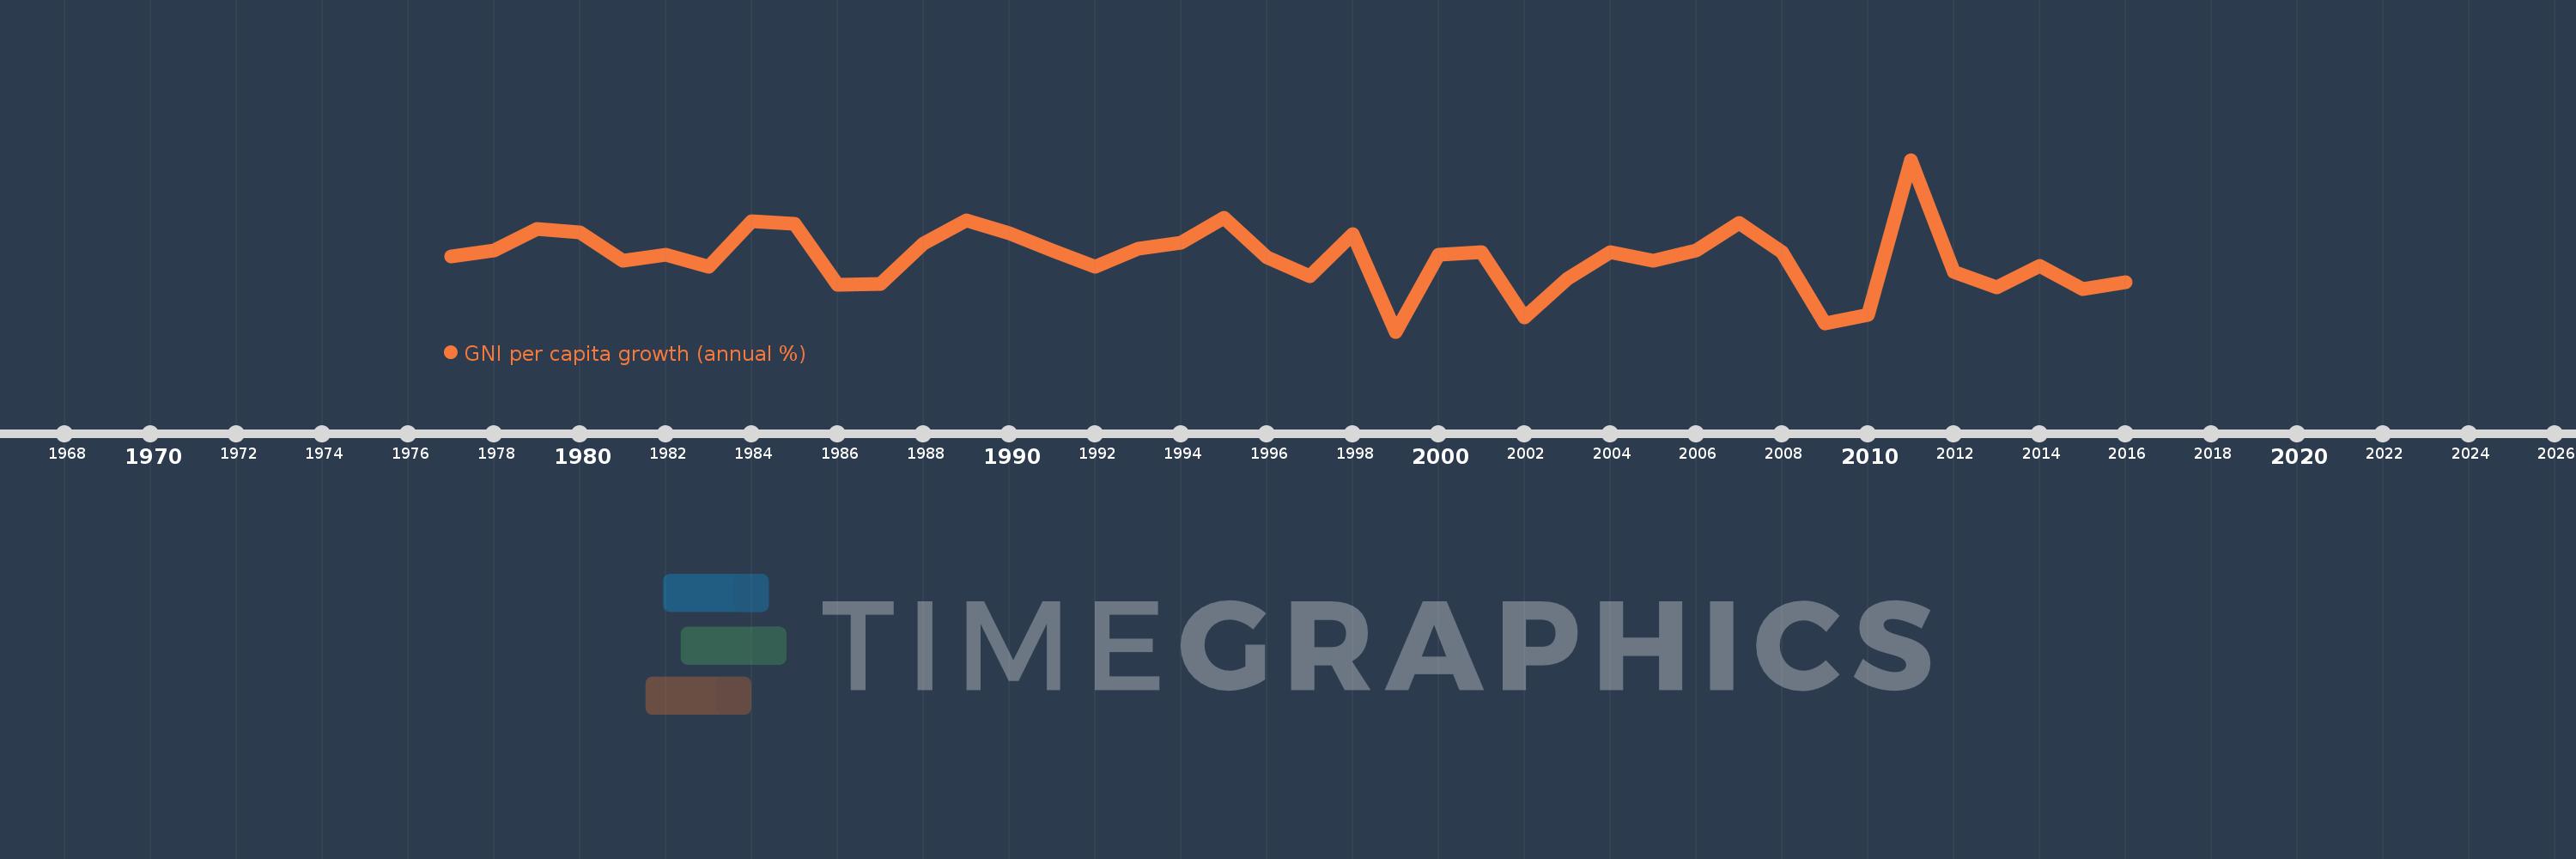
Nesta escala de tempo está apresentado um gráfico de 1977 ano até 2016 ano Singapore. Dados de 1976 ano ausente. O número de observações reais por data: 40.
Fonte (nome):
Indicadores de desenvolvimento mundial
Fonte (organização):
World Bank national accounts data, and OECD National Accounts data files.
Categorias:
Economy & Growth
Foi atualizado:
23 abr 2017 ano
Indicadores de alterações dos valores ao longo dos anos
Mínimo:
-5.926
1 jan 1999 ano
Máximo:
17.995
1 jan 2011 ano
Na data de observação
Valor
Mudança absoluta
A alteração em relação ao valor anterior
1 jan 1977 ano
4.588
+4.588
0.0%
1 jan 1978 ano
5.372
+0.784
17.09%
1 jan 1979 ano
8.352
+2.98
55.47%
1 jan 1980 ano
7.915
-0.438
-5.24%
1 jan 1981 ano
3.939
-3.976
-50.24%
1 jan 1982 ano
4.767
+0.829
21.04%
1 jan 1983 ano
3.159
-1.608
-33.73%
1 jan 1984 ano
9.48
+6.321
200.08%
1 jan 1985 ano
9.043
-0.437
-4.61%
1 jan 1986 ano
0.575
-8.468
-93.64%
1 jan 1987 ano
0.657
+0.082
14.34%
1 jan 1988 ano
6.339
+5.681
864.44%
1 jan 1989 ano
9.62
+3.282
51.77%
1 jan 1990 ano
7.793
-1.828
-19.0%
1 jan 1991 ano
5.423
-2.369
-30.41%
1 jan 1992 ano
3.135
-2.288
-42.19%
1 jan 1993 ano
5.608
+2.473
78.88%
1 jan 1994 ano
6.403
+0.795
14.18%
1 jan 1995 ano
9.954
+3.551
55.47%
1 jan 1996 ano
4.454
-5.5
-55.25%
1 jan 1997 ano
1.735
-2.719
-61.05%
1 jan 1998 ano
7.599
+5.864
338.04%
1 jan 1999 ano
-5.926
-13.525
-177.98%
1 jan 2000 ano
4.833
+10.759
-181.56%
1 jan 2001 ano
5.182
+0.349
7.22%
1 jan 2002 ano
-4.009
-9.191
-177.37%
1 jan 2003 ano
1.461
+5.471
-136.45%
1 jan 2004 ano
5.144
+3.682
251.99%
1 jan 2005 ano
3.981
-1.163
-22.61%
1 jan 2006 ano
5.399
+1.419
35.64%
1 jan 2007 ano
9.183
+3.784
70.07%
1 jan 2008 ano
5.145
-4.038
-43.97%
1 jan 2009 ano
-4.789
-9.934
-193.08%
1 jan 2010 ano
-3.592
+1.197
-24.99%
1 jan 2011 ano
17.995
+21.587
-600.94%
1 jan 2012 ano
2.386
-15.609
-86.74%
1 jan 2013 ano
0.188
-2.198
-92.12%
1 jan 2014 ano
3.189
+3.002
1.6 mil%
1 jan 2015 ano
0.004
-3.186
-99.89%
1 jan 2016 ano
0.922
+0.919
26.19 mil%
Classificação de países por estatísticas atuais por anos


Comentários: