29
/pt/
pt
AIzaSyAYiBZKx7MnpbEhh9jyipgxe19OcubqV5w
April 1, 2024
235317
Senegal
SEN
true
2
1
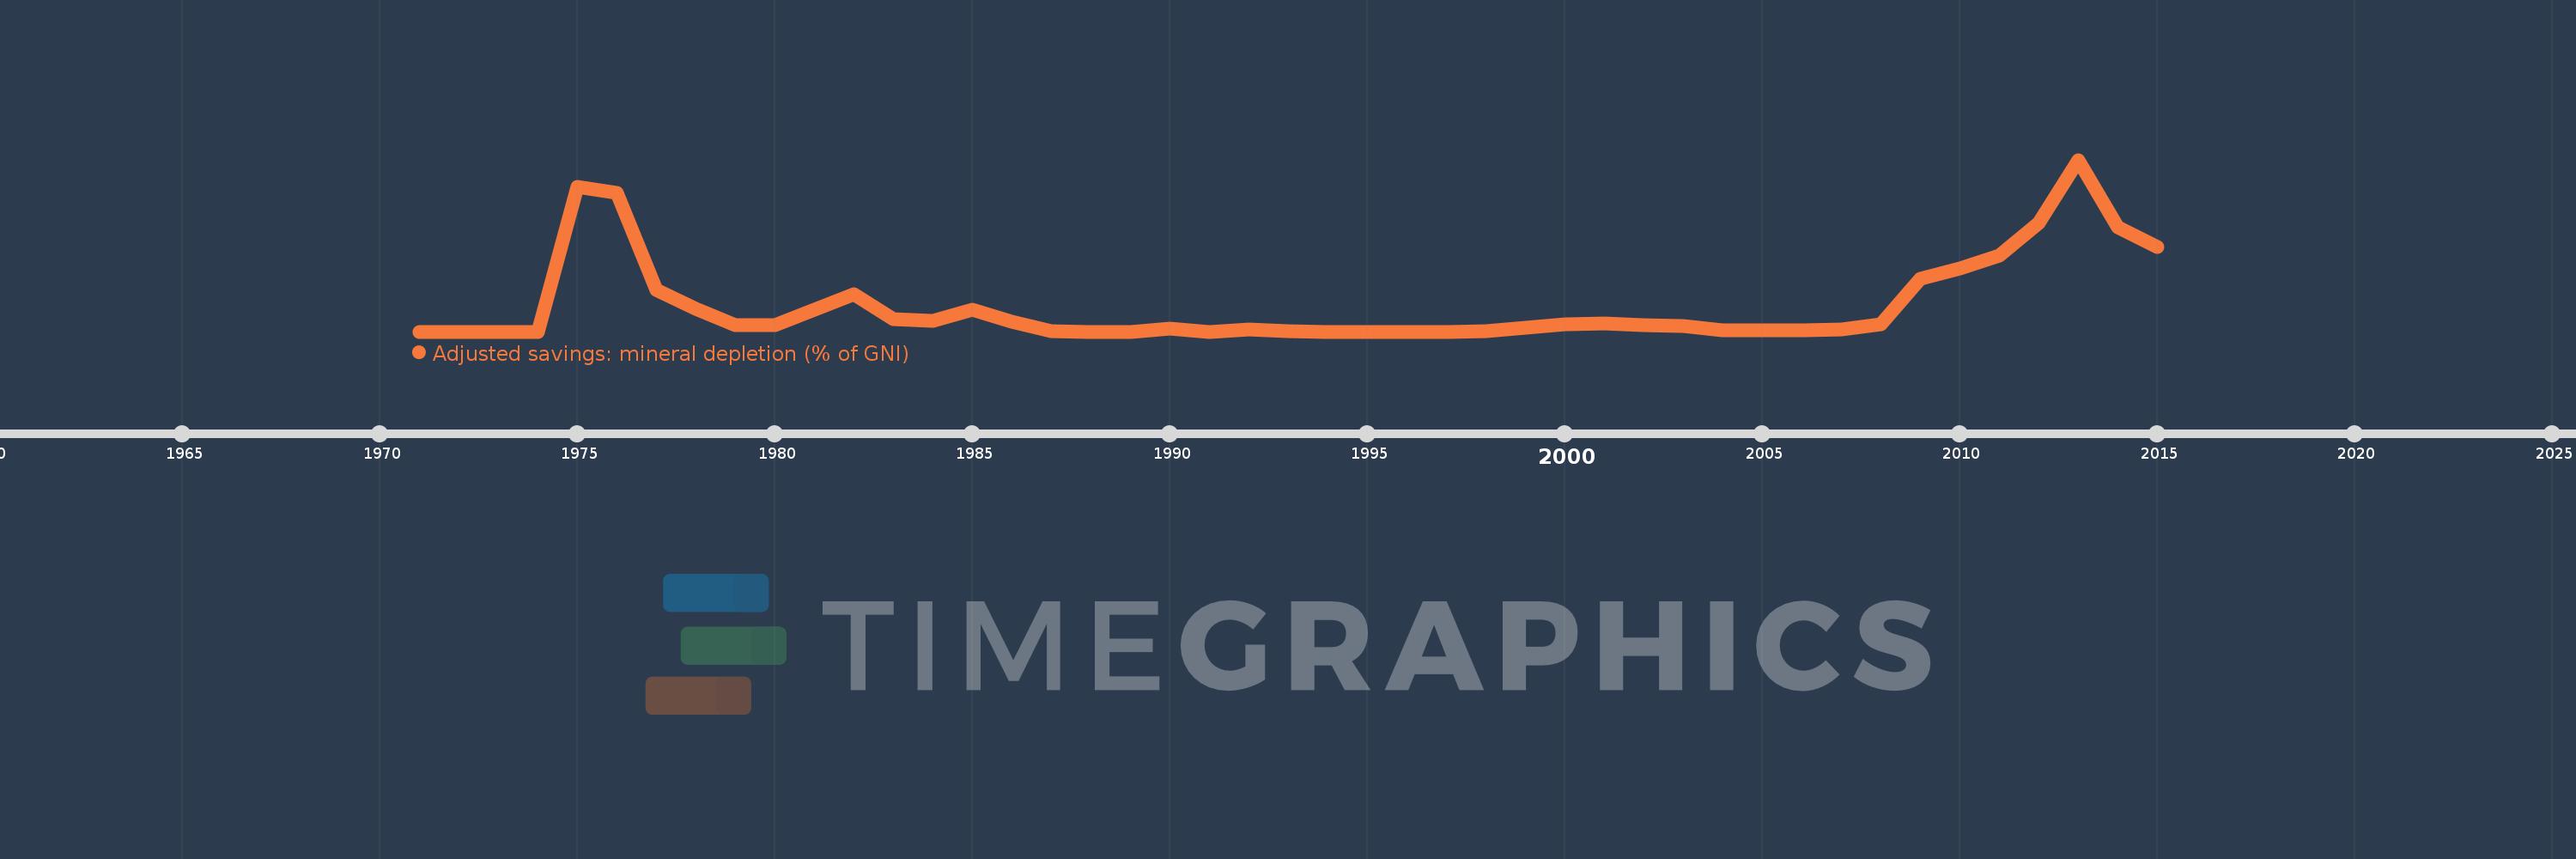
Adjusted savings: mineral depletion (% of GNI)
2015,2014,2013,2012,2011,2010,2009,2008,2007,2006,2005,2004,2003,2002,2001,2000,1999,1998,1997,1996,1995,1994,1993,1992,1991,1990,1989,1988,1987,1986,1985,1984,1983,1982,1981,1980,1979,1978,1977,1976,1975,1974,1973,1972,1971
Estas estatísticas em outros países:
AfghanistanAlbaniaAlgeriaAmerican SamoaAndorraAngolaAntigua and BarbudaArab WorldArgentinaArmeniaAustraliaAustriaAzerbaijanBahamas, TheBahrainBangladeshBarbadosBelarusBelgiumBelizeBeninBermudaBhutanBoliviaBosnia and HerzegovinaBotswanaBrazilBrunei DarussalamBulgariaBurkina FasoBurundiCabo VerdeCambodiaCameroonCanadaCaribbean small statesCentral African RepublicCentral Europe and the BalticsChadChannel IslandsChileChinaColombiaComorosCongo, Dem. Rep.Congo, Rep.Costa RicaCote d'IvoireCroatiaCubaCyprusCzech RepublicDenmarkDjiboutiDominicaDominican RepublicEarly-demographic dividendEast Asia & PacificEast Asia & Pacific (excluding high income)East Asia & Pacific (IDA & IBRD countries)EcuadorEgypt, Arab Rep.El SalvadorEquatorial GuineaEritreaEstoniaEthiopiaEuro areaEurope & Central AsiaEurope & Central Asia (excluding high income)Europe & Central Asia (IDA & IBRD countries)European UnionFaroe IslandsFijiFinlandFragile and conflict affected situationsFranceFrench PolynesiaGabonGambia, TheGeorgiaGermanyGhanaGreeceGreenlandGrenadaGuatemalaGuineaGuinea-BissauGuyanaHaitiHeavily indebted poor countries (HIPC)High incomeHondurasHong Kong SAR, ChinaHungaryIBRD onlyIcelandIDA & IBRD totalIDA blendIDA onlyIDA totalIndiaIndonesiaIran, Islamic Rep.IraqIrelandIsle of ManIsraelItalyJamaicaJapanJordanKazakhstanKenyaKiribatiKorea, Rep.KosovoKuwaitKyrgyz RepublicLao PDRLate-demographic dividendLatin America & Caribbean Latin America & Caribbean (excluding high income)Latin America & the Caribbean (IDA & IBRD countries)LatviaLeast developed countries: UN classificationLebanonLesothoLiberiaLibyaLiechtensteinLithuaniaLow & middle incomeLow incomeLower middle incomeLuxembourgMacao SAR, ChinaMacedonia, FYRMadagascarMalawiMalaysiaMaldivesMaliMaltaMarshall IslandsMauritaniaMauritiusMexicoMicronesia, Fed. Sts.Middle East & North AfricaMiddle East & North Africa (excluding high income)Middle East & North Africa (IDA & IBRD countries)Middle incomeMoldovaMonacoMongoliaMontenegroMoroccoMozambiqueMyanmarNamibiaNepalNetherlandsNew CaledoniaNew ZealandNicaraguaNigerNigeriaNorth AmericaNorwayOECD membersOmanOther small statesPacific island small statesPakistanPalauPanamaPapua New GuineaParaguayPeruPhilippinesPolandPortugalPost-demographic dividendPre-demographic dividendPuerto RicoQatarRomaniaRussian FederationRwandaSamoaSan MarinoSao Tome and PrincipeSaudi ArabiaSenegalSerbiaSeychellesSierra LeoneSingaporeSlovak RepublicSloveniaSmall statesSolomon IslandsSomaliaSouth AfricaSouth AsiaSouth Asia (IDA & IBRD)South SudanSpainSri LankaSt. Kitts and NevisSt. LuciaSt. Vincent and the GrenadinesSub-Saharan Africa Sub-Saharan Africa (excluding high income)Sub-Saharan Africa (IDA & IBRD countries)SudanSurinameSwazilandSwedenSwitzerlandSyrian Arab RepublicTajikistanTanzaniaThailandTimor-LesteTogoTongaTrinidad and TobagoTunisiaTurkeyTurkmenistanTuvaluUgandaUkraineUnited Arab EmiratesUnited KingdomUnited StatesUpper middle incomeUruguayUzbekistanVanuatuVenezuela, RBVietnamVirgin Islands (U.S.)West Bank and GazaWorldYemen, Rep.ZambiaZimbabwe Linha do tempo:
Nesta escala de tempo está apresentado um gráfico de 1971 ano até 2015 ano Senegal. Dados de 1970 ano ausente. O número de observações reais por data: 45.
Fonte (nome):
Indicadores de desenvolvimento mundial
Fonte (organização):
World Bank staff estimates based on sources and methods in World Bank's "The Changing Wealth of Nations: Measuring Sustainable Development in the New Millennium" (2011).
Categorias:
Economy & Growth, Energy & Mining, Environment
Foi atualizado:
23 abr 2017 ano
Indicadores de alterações dos valores ao longo dos anos
Máximo:
2.23
1 jan 2013 ano
Na data de observação
Valor
Mudança absoluta
A alteração em relação ao valor anterior
1 jan 1971 ano
0.0
0.0
0.0%
1 jan 1975 ano
1.877
+1.877
%
1 jan 1976 ano
1.803
-0.075
-3.97%
1 jan 1977 ano
0.545
-1.258
-69.76%
1 jan 1978 ano
0.3
-0.245
-44.98%
1 jan 1979 ano
0.088
-0.212
-70.61%
1 jan 1980 ano
0.087
-0.001
-1.18%
1 jan 1981 ano
0.279
+0.192
220.65%
1 jan 1982 ano
0.487
+0.207
74.21%
1 jan 1983 ano
0.163
-0.324
-66.59%
1 jan 1984 ano
0.137
-0.026
-15.89%
1 jan 1985 ano
0.283
+0.146
106.79%
1 jan 1986 ano
0.127
-0.156
-55.14%
1 jan 1987 ano
0.009
-0.118
-93.25%
1 jan 1988 ano
0.0
-0.009
-100.0%
1 jan 1990 ano
0.035
+0.035
%
1 jan 1991 ano
0.0
-0.035
-100.0%
1 jan 1992 ano
0.031
+0.031
%
1 jan 1993 ano
0.011
-0.02
-63.35%
1 jan 1994 ano
0.0
-0.011
-100.0%
1 jan 1998 ano
0.01
+0.01
%
1 jan 1999 ano
0.045
+0.035
353.28%
1 jan 2000 ano
0.096
+0.051
112.63%
1 jan 2001 ano
0.106
+0.011
11.02%
1 jan 2002 ano
0.088
-0.018
-17.3%
1 jan 2003 ano
0.068
-0.02
-22.39%
1 jan 2004 ano
0.016
-0.052
-76.63%
1 jan 2005 ano
0.019
+0.003
19.45%
1 jan 2006 ano
0.014
-0.005
-25.29%
1 jan 2007 ano
0.027
+0.013
91.48%
1 jan 2008 ano
0.094
+0.067
246.08%
1 jan 2009 ano
0.687
+0.593
629.39%
1 jan 2010 ano
0.82
+0.132
19.28%
1 jan 2011 ano
0.985
+0.165
20.12%
1 jan 2012 ano
1.411
+0.426
43.29%
1 jan 2013 ano
2.23
+0.819
58.06%
1 jan 2014 ano
1.357
-0.874
-39.18%
1 jan 2015 ano
1.102
-0.255
-18.78%
Classificação de países por estatísticas atuais por anos


Comentários: