29
/pt/
pt
AIzaSyAYiBZKx7MnpbEhh9jyipgxe19OcubqV5w
April 1, 2024
233601
Sao Tome and Principe
STP
true
2
1
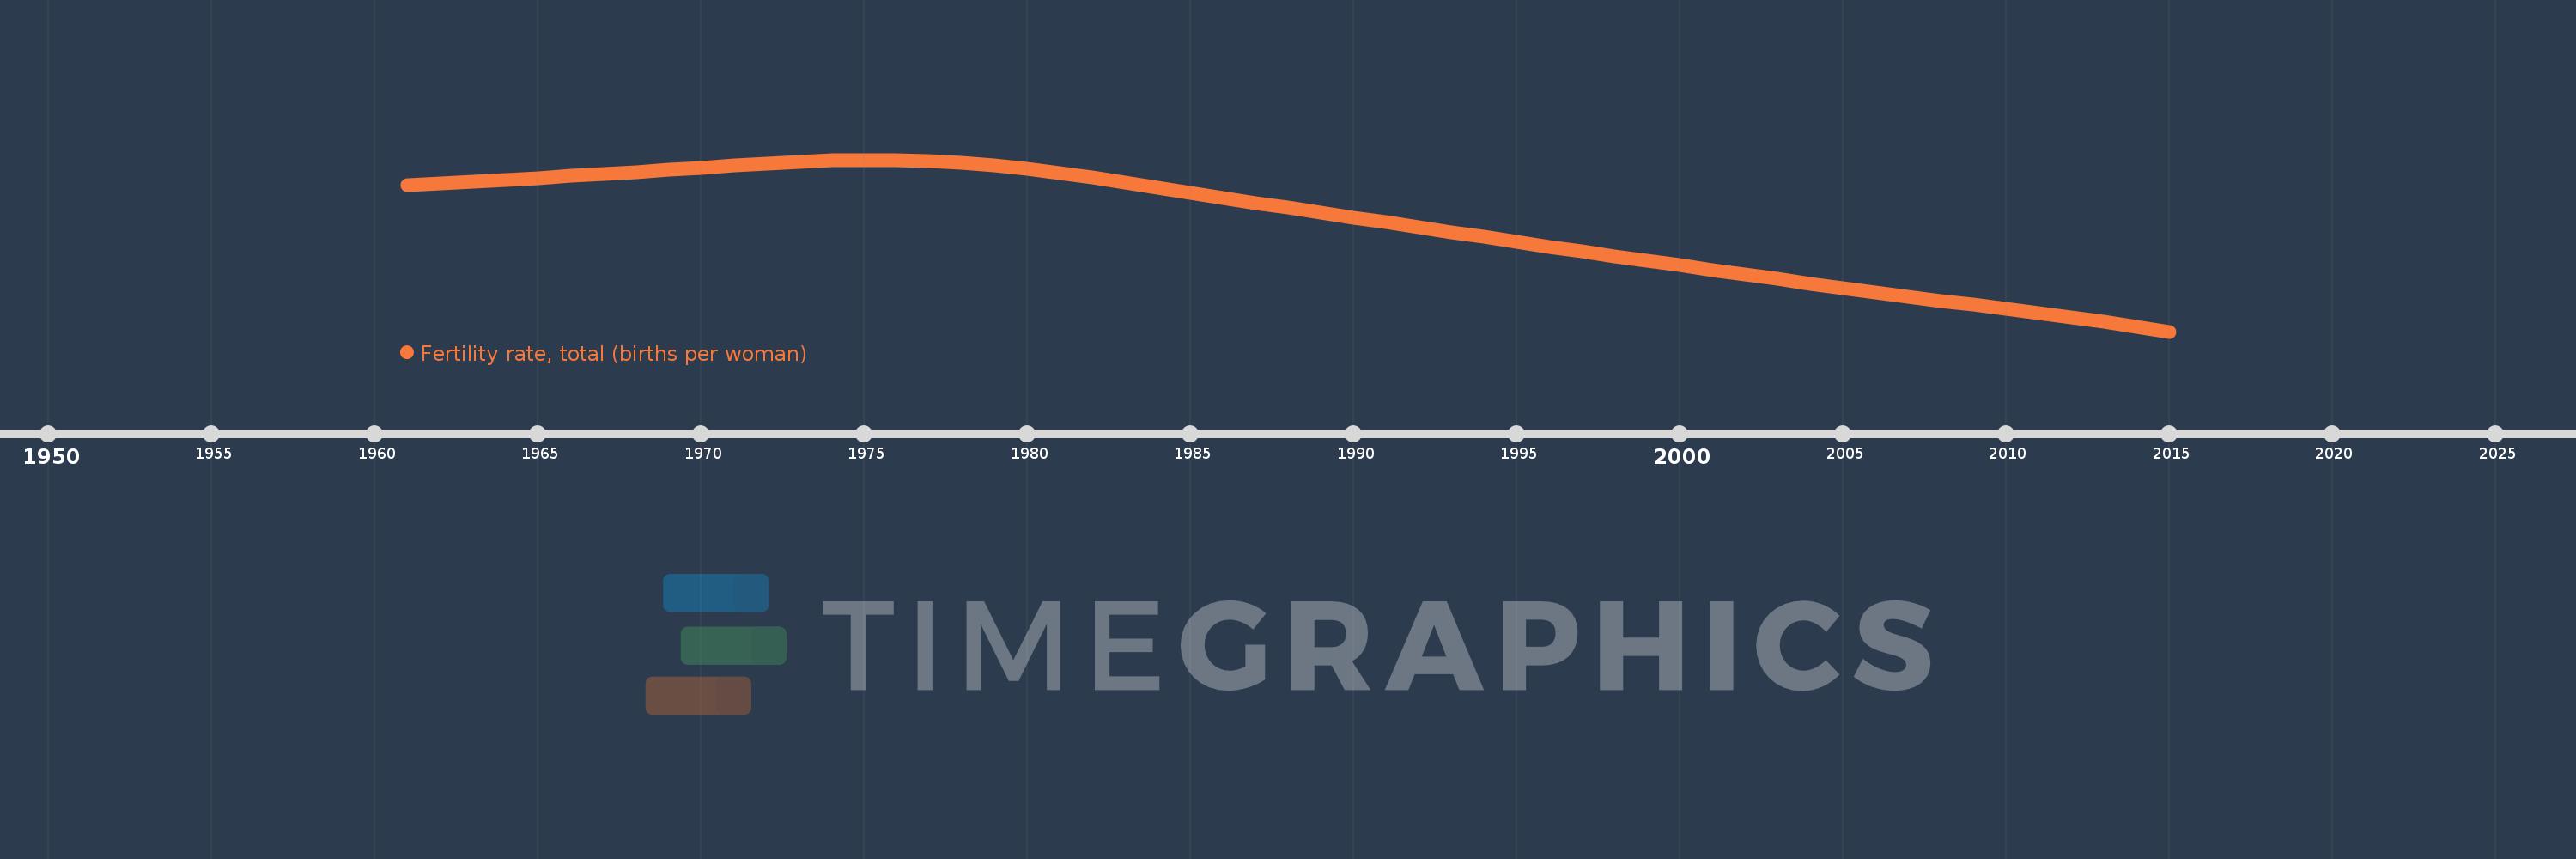
Fertility rate, total (births per woman)
2015,2014,2013,2012,2011,2010,2009,2008,2007,2006,2005,2004,2003,2002,2001,2000,1999,1998,1997,1996,1995,1994,1993,1992,1991,1990,1989,1988,1987,1986,1985,1984,1983,1982,1981,1980,1979,1978,1977,1976,1975,1974,1973,1972,1971,1970,1969,1968,1967,1966,1965,1964,1963,1962,1961
Estas estatísticas em outros países:
AfghanistanAlbaniaAlgeriaAndorraAngolaAntigua and BarbudaArab WorldArgentinaArmeniaArubaAustraliaAustriaAzerbaijanBahamas, TheBahrainBangladeshBarbadosBelarusBelgiumBelizeBeninBermudaBhutanBoliviaBosnia and HerzegovinaBotswanaBrazilBrunei DarussalamBulgariaBurkina FasoBurundiCabo VerdeCambodiaCameroonCanadaCaribbean small statesCentral African RepublicCentral Europe and the BalticsChadChannel IslandsChileChinaColombiaComorosCongo, Dem. Rep.Congo, Rep.Costa RicaCote d'IvoireCroatiaCubaCuracaoCyprusCzech RepublicDenmarkDjiboutiDominicaDominican RepublicEarly-demographic dividendEast Asia & PacificEast Asia & Pacific (excluding high income)East Asia & Pacific (IDA & IBRD countries)EcuadorEgypt, Arab Rep.El SalvadorEquatorial GuineaEritreaEstoniaEthiopiaEuro areaEurope & Central AsiaEurope & Central Asia (excluding high income)Europe & Central Asia (IDA & IBRD countries)European UnionFaroe IslandsFijiFinlandFragile and conflict affected situationsFranceFrench PolynesiaGabonGambia, TheGeorgiaGermanyGhanaGreeceGreenlandGrenadaGuamGuatemalaGuineaGuinea-BissauGuyanaHaitiHeavily indebted poor countries (HIPC)High incomeHondurasHong Kong SAR, ChinaHungaryIBRD onlyIcelandIDA & IBRD totalIDA blendIDA onlyIDA totalIndiaIndonesiaIran, Islamic Rep.IraqIrelandIsle of ManIsraelItalyJamaicaJapanJordanKazakhstanKenyaKiribatiKorea, Dem. People’s Rep.Korea, Rep.KosovoKuwaitKyrgyz RepublicLao PDRLate-demographic dividendLatin America & Caribbean Latin America & Caribbean (excluding high income)Latin America & the Caribbean (IDA & IBRD countries)LatviaLeast developed countries: UN classificationLebanonLesothoLiberiaLibyaLiechtensteinLithuaniaLow & middle incomeLow incomeLower middle incomeLuxembourgMacao SAR, ChinaMacedonia, FYRMadagascarMalawiMalaysiaMaldivesMaliMaltaMarshall IslandsMauritaniaMauritiusMexicoMicronesia, Fed. Sts.Middle East & North AfricaMiddle East & North Africa (excluding high income)Middle East & North Africa (IDA & IBRD countries)Middle incomeMoldovaMongoliaMontenegroMoroccoMozambiqueMyanmarNamibiaNepalNetherlandsNew CaledoniaNew ZealandNicaraguaNigerNigeriaNorth AmericaNorwayOECD membersOmanOther small statesPacific island small statesPakistanPalauPanamaPapua New GuineaParaguayPeruPhilippinesPolandPortugalPost-demographic dividendPre-demographic dividendPuerto RicoQatarRomaniaRussian FederationRwandaSamoaSan MarinoSao Tome and PrincipeSaudi ArabiaSenegalSerbiaSeychellesSierra LeoneSingaporeSint Maarten (Dutch part)Slovak RepublicSloveniaSmall statesSolomon IslandsSomaliaSouth AfricaSouth AsiaSouth Asia (IDA & IBRD)South SudanSpainSri LankaSt. Kitts and NevisSt. LuciaSt. Martin (French part)St. Vincent and the GrenadinesSub-Saharan Africa Sub-Saharan Africa (excluding high income)Sub-Saharan Africa (IDA & IBRD countries)SudanSurinameSwazilandSwedenSwitzerlandSyrian Arab RepublicTajikistanTanzaniaThailandTimor-LesteTogoTongaTrinidad and TobagoTunisiaTurkeyTurkmenistanUgandaUkraineUnited Arab EmiratesUnited KingdomUnited StatesUpper middle incomeUruguayUzbekistanVanuatuVenezuela, RBVietnamVirgin Islands (U.S.)West Bank and GazaWorldYemen, Rep.ZambiaZimbabwe Linha do tempo:
Nesta escala de tempo está apresentado um gráfico de 1961 ano até 2015 ano Sao Tome and Principe. Dados de 1960 ano ausente. O número de observações reais por data: 55.
Fonte (nome):
Indicadores de desenvolvimento mundial
Fonte (organização):
(1) United Nations Population Division. World Population Prospects, (2) Census reports and other statistical publications from national statistical offices, (3) Eurostat: Demographic Statistics, (4) United Nations Statistical Division. Population and Vital Statistics Reprot (various years), (5) U.S. Census Bureau: International Database, and (6) Secretariat of the Pacific Community: Statistics and Demography Programme.
Categorias:
Health, Gender
Foi atualizado:
23 abr 2017 ano
Indicadores de alterações dos valores ao longo dos anos
Mínimo:
4.576
1 jan 2015 ano
Máximo:
6.534
1 jan 1975 ano
Na data de observação
Valor
Mudança absoluta
A alteração em relação ao valor anterior
1 jan 1961 ano
6.242
+6.242
0.0%
1 jan 1962 ano
6.263
+0.021
0.34%
1 jan 1963 ano
6.284
+0.021
0.34%
1 jan 1964 ano
6.306
+0.022
0.35%
1 jan 1965 ano
6.327
+0.021
0.33%
1 jan 1966 ano
6.349
+0.022
0.35%
1 jan 1967 ano
6.371
+0.022
0.35%
1 jan 1968 ano
6.394
+0.023
0.36%
1 jan 1969 ano
6.419
+0.025
0.39%
1 jan 1970 ano
6.444
+0.025
0.39%
1 jan 1971 ano
6.468
+0.024
0.37%
1 jan 1972 ano
6.49
+0.022
0.34%
1 jan 1973 ano
6.51
+0.02
0.31%
1 jan 1974 ano
6.525
+0.015
0.23%
1 jan 1975 ano
6.534
+0.009
0.14%
1 jan 1976 ano
6.534
0.0
0.0%
1 jan 1977 ano
6.524
-0.01
-0.15%
1 jan 1978 ano
6.504
-0.02
-0.31%
1 jan 1979 ano
6.473
-0.031
-0.48%
1 jan 1980 ano
6.434
-0.039
-0.6%
1 jan 1981 ano
6.386
-0.048
-0.75%
1 jan 1982 ano
6.333
-0.053
-0.83%
1 jan 1983 ano
6.276
-0.057
-0.9%
1 jan 1984 ano
6.217
-0.059
-0.94%
1 jan 1985 ano
6.158
-0.059
-0.95%
1 jan 1986 ano
6.101
-0.057
-0.93%
1 jan 1987 ano
6.044
-0.057
-0.93%
1 jan 1988 ano
5.988
-0.056
-0.93%
1 jan 1989 ano
5.932
-0.056
-0.94%
1 jan 1990 ano
5.876
-0.056
-0.94%
1 jan 1991 ano
5.82
-0.056
-0.95%
1 jan 1992 ano
5.765
-0.055
-0.95%
1 jan 1993 ano
5.71
-0.055
-0.95%
1 jan 1994 ano
5.655
-0.055
-0.96%
1 jan 1995 ano
5.6
-0.055
-0.97%
1 jan 1996 ano
5.545
-0.055
-0.98%
1 jan 1997 ano
5.491
-0.054
-0.97%
1 jan 1998 ano
5.437
-0.054
-0.98%
1 jan 1999 ano
5.384
-0.053
-0.97%
1 jan 2000 ano
5.33
-0.054
-1.0%
1 jan 2001 ano
5.278
-0.052
-0.98%
1 jan 2002 ano
5.226
-0.052
-0.99%
1 jan 2003 ano
5.174
-0.052
-1.0%
1 jan 2004 ano
5.123
-0.051
-0.99%
1 jan 2005 ano
5.072
-0.051
-1.0%
1 jan 2006 ano
5.022
-0.05
-0.99%
1 jan 2007 ano
4.974
-0.048
-0.96%
1 jan 2008 ano
4.927
-0.047
-0.94%
1 jan 2009 ano
4.881
-0.046
-0.93%
1 jan 2010 ano
4.835
-0.046
-0.94%
1 jan 2011 ano
4.789
-0.046
-0.95%
1 jan 2012 ano
4.74
-0.049
-1.02%
1 jan 2013 ano
4.689
-0.051
-1.08%
1 jan 2014 ano
4.634
-0.055
-1.17%
1 jan 2015 ano
4.576
-0.058
-1.25%
Classificação de países por estatísticas atuais por anos


Comentários: