29
/pt/
pt
AIzaSyAYiBZKx7MnpbEhh9jyipgxe19OcubqV5w
April 1, 2024
225999
Portugal
PRT
true
2
1
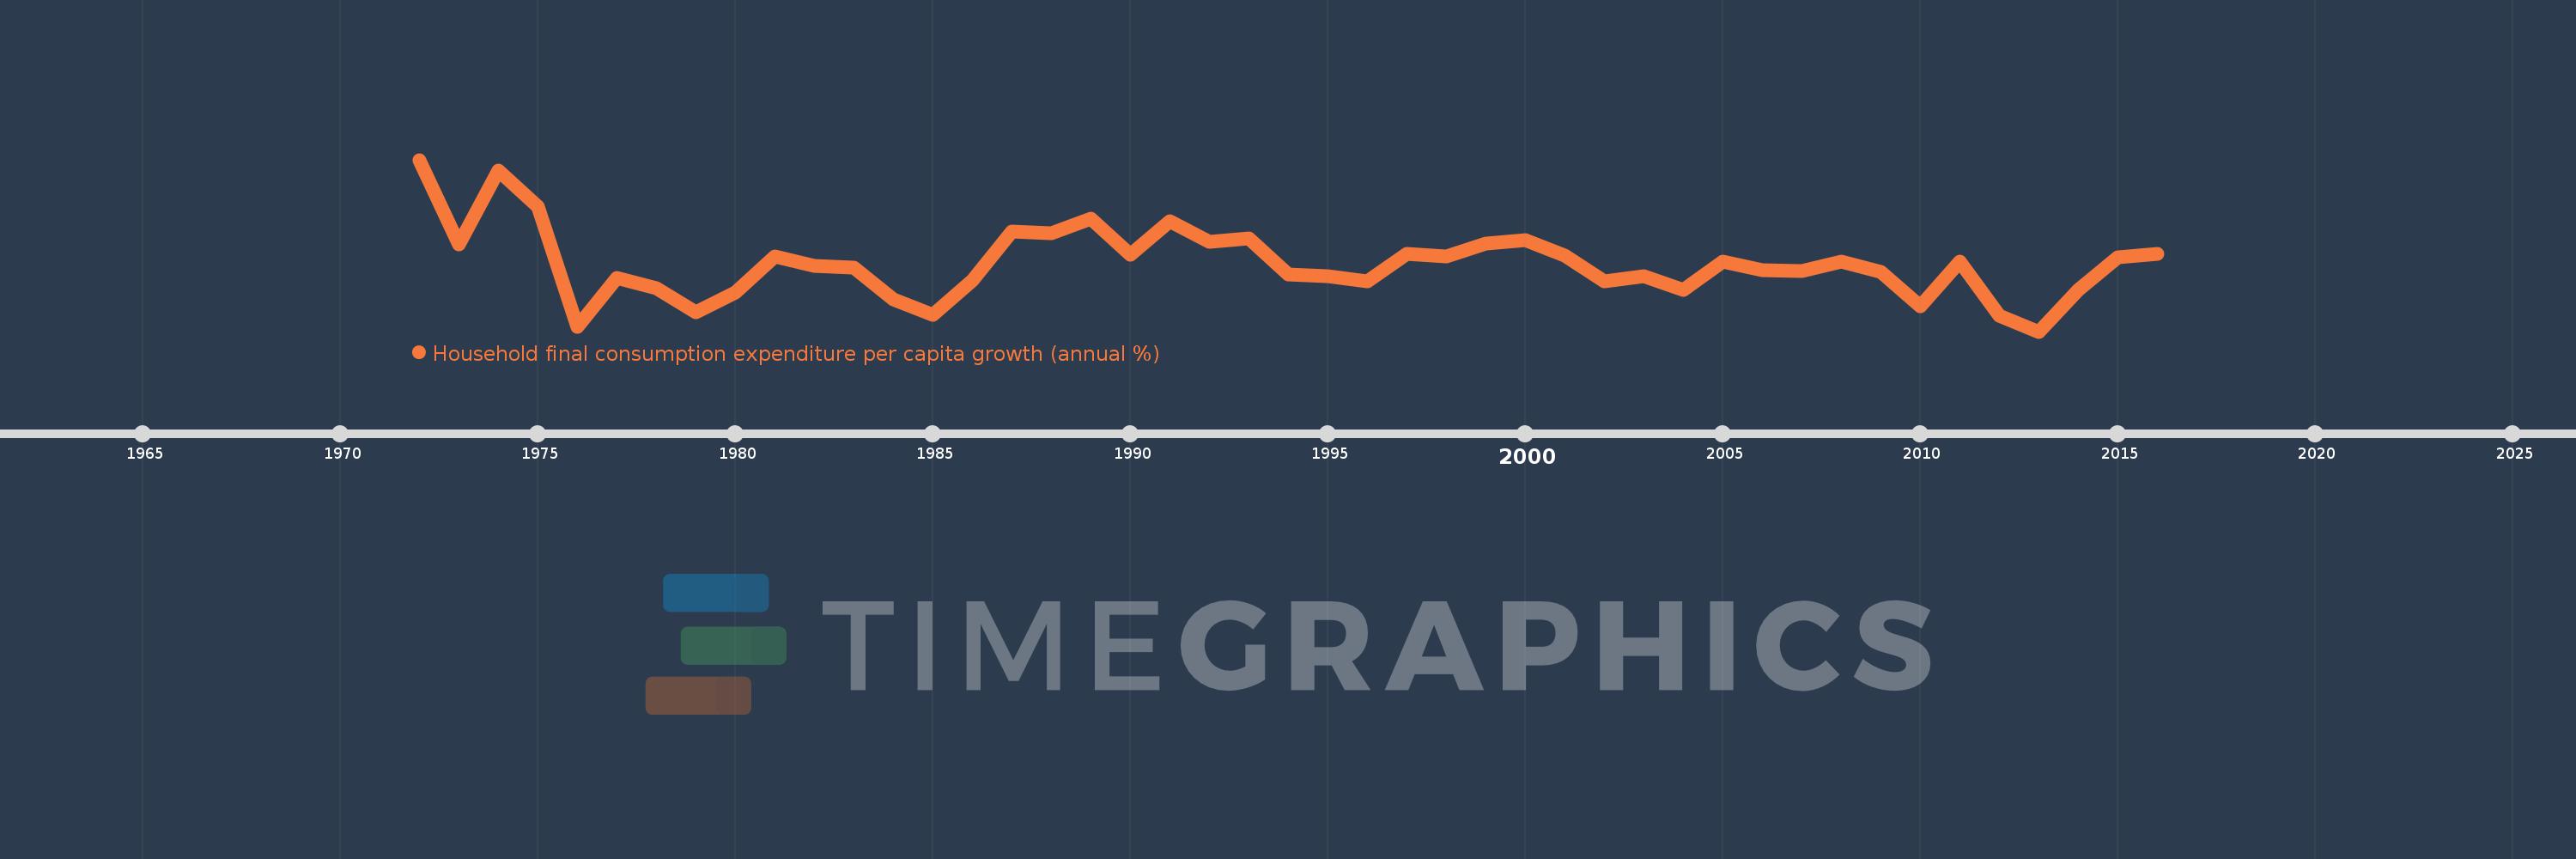
Household final consumption expenditure per capita growth (annual %)
2016,2015,2014,2013,2012,2011,2010,2009,2008,2007,2006,2005,2004,2003,2002,2001,2000,1999,1998,1997,1996,1995,1994,1993,1992,1991,1990,1989,1988,1987,1986,1985,1984,1983,1982,1981,1980,1979,1978,1977,1976,1975,1974,1973,1972
Estas estatísticas em outros países:
AlbaniaAlgeriaAntigua and BarbudaArab WorldArgentinaArmeniaAustraliaAustriaAzerbaijanBahamas, TheBahrainBangladeshBarbadosBelarusBelgiumBelizeBeninBhutanBoliviaBosnia and HerzegovinaBotswanaBrazilBrunei DarussalamBulgariaBurkina FasoBurundiCabo VerdeCambodiaCameroonCanadaCaribbean small statesCentral Europe and the BalticsChadChileChinaColombiaComorosCongo, Dem. Rep.Congo, Rep.Costa RicaCote d'IvoireCroatiaCubaCyprusCzech RepublicDenmarkDominican RepublicEarly-demographic dividendEast Asia & PacificEast Asia & Pacific (excluding high income)East Asia & Pacific (IDA & IBRD countries)EcuadorEgypt, Arab Rep.El SalvadorEquatorial GuineaEritreaEstoniaEuro areaEurope & Central AsiaEurope & Central Asia (excluding high income)Europe & Central Asia (IDA & IBRD countries)European UnionFinlandFranceGabonGambia, TheGermanyGhanaGreeceGuatemalaGuineaGuinea-BissauHaitiHeavily indebted poor countries (HIPC)High incomeHondurasHong Kong SAR, ChinaHungaryIBRD onlyIcelandIDA & IBRD totalIDA blendIDA onlyIDA totalIndiaIndonesiaIran, Islamic Rep.IrelandIsraelItalyJamaicaJapanJordanKazakhstanKenyaKorea, Rep.KosovoKuwaitKyrgyz RepublicLate-demographic dividendLatin America & Caribbean Latin America & Caribbean (excluding high income)Latin America & the Caribbean (IDA & IBRD countries)LatviaLeast developed countries: UN classificationLebanonLiberiaLithuaniaLow & middle incomeLow incomeLower middle incomeLuxembourgMacao SAR, ChinaMacedonia, FYRMadagascarMalawiMalaysiaMaliMaltaMauritaniaMauritiusMexicoMiddle East & North AfricaMiddle East & North Africa (excluding high income)Middle East & North Africa (IDA & IBRD countries)Middle incomeMoldovaMongoliaMontenegroMoroccoMozambiqueNamibiaNepalNetherlandsNew ZealandNicaraguaNigerNigeriaNorth AmericaNorwayOECD membersOmanOther small statesPakistanPanamaParaguayPeruPhilippinesPolandPortugalPost-demographic dividendPre-demographic dividendPuerto RicoQatarRomaniaRussian FederationRwandaSaudi ArabiaSenegalSerbiaSierra LeoneSingaporeSlovak RepublicSloveniaSmall statesSouth AfricaSouth AsiaSouth Asia (IDA & IBRD)South SudanSpainSri LankaSub-Saharan Africa Sub-Saharan Africa (excluding high income)Sub-Saharan Africa (IDA & IBRD countries)SudanSurinameSwazilandSwedenSwitzerlandTajikistanTanzaniaThailandTimor-LesteTogoTrinidad and TobagoTunisiaTurkeyUgandaUkraineUnited Arab EmiratesUnited KingdomUnited StatesUpper middle incomeUruguayVanuatuVenezuela, RBVietnamWest Bank and GazaWorldZimbabwe Linha do tempo:
Nesta escala de tempo está apresentado um gráfico de 1972 ano até 2016 ano Portugal. Dados de 1971 ano ausente. O número de observações reais por data: 45.
Fonte (nome):
Indicadores de desenvolvimento mundial
Fonte (organização):
World Bank national accounts data, and OECD National Accounts data files.
Categorias:
Economy & Growth
Foi atualizado:
23 abr 2017 ano
Indicadores de alterações dos valores ao longo dos anos
Mínimo:
-5.11
1 jan 2013 ano
Máximo:
13.16
1 jan 1972 ano
Na data de observação
Valor
Mudança absoluta
A alteração em relação ao valor anterior
1 jan 1972 ano
13.16
+13.16
0.0%
1 jan 1973 ano
4.188
-8.972
-68.18%
1 jan 1974 ano
11.988
+7.8
186.27%
1 jan 1975 ano
8.219
-3.769
-31.44%
1 jan 1976 ano
-4.581
-12.8
-155.74%
1 jan 1977 ano
0.598
+5.179
-113.04%
1 jan 1978 ano
-0.463
-1.06
-177.41%
1 jan 1979 ano
-3.089
-2.627
567.86%
1 jan 1980 ano
-0.954
+2.136
-69.14%
1 jan 1981 ano
2.907
+3.86
-404.85%
1 jan 1982 ano
1.871
-1.035
-35.62%
1 jan 1983 ano
1.673
-0.199
-10.61%
1 jan 1984 ano
-1.693
-3.365
-201.19%
1 jan 1985 ano
-3.372
-1.679
99.21%
1 jan 1986 ano
0.366
+3.738
-110.85%
1 jan 1987 ano
5.541
+5.176
1.41 mil%
1 jan 1988 ano
5.315
-0.227
-4.09%
1 jan 1989 ano
6.937
+1.623
30.53%
1 jan 1990 ano
3.094
-3.844
-55.41%
1 jan 1991 ano
6.671
+3.578
115.65%
1 jan 1992 ano
4.47
-2.201
-32.99%
1 jan 1993 ano
4.818
+0.348
7.79%
1 jan 1994 ano
0.978
-3.84
-79.7%
1 jan 1995 ano
0.754
-0.224
-22.94%
1 jan 1996 ano
0.248
-0.505
-67.04%
1 jan 1997 ano
3.128
+2.879
1.16 mil%
1 jan 1998 ano
2.88
-0.248
-7.93%
1 jan 1999 ano
4.264
+1.385
48.08%
1 jan 2000 ano
4.661
+0.396
9.3%
1 jan 2001 ano
2.964
-1.697
-36.41%
1 jan 2002 ano
0.24
-2.724
-91.91%
1 jan 2003 ano
0.759
+0.52
216.65%
1 jan 2004 ano
-0.648
-1.407
-185.27%
1 jan 2005 ano
2.315
+2.962
-457.43%
1 jan 2006 ano
1.398
-0.917
-39.61%
1 jan 2007 ano
1.323
-0.075
-5.33%
1 jan 2008 ano
2.323
+1.0
75.55%
1 jan 2009 ano
1.229
-1.094
-47.09%
1 jan 2010 ano
-2.43
-3.659
-297.7%
1 jan 2011 ano
2.351
+4.78
-196.74%
1 jan 2012 ano
-3.463
-5.813
-247.31%
1 jan 2013 ano
-5.11
-1.647
47.57%
1 jan 2014 ano
-0.654
+4.456
-87.2%
1 jan 2015 ano
2.798
+3.452
-527.94%
1 jan 2016 ano
3.138
+0.339
12.13%
Classificação de países por estatísticas atuais por anos


Comentários: