29
/pt/
pt
AIzaSyAYiBZKx7MnpbEhh9jyipgxe19OcubqV5w
April 1, 2024
225107
Poland
POL
true
2
1
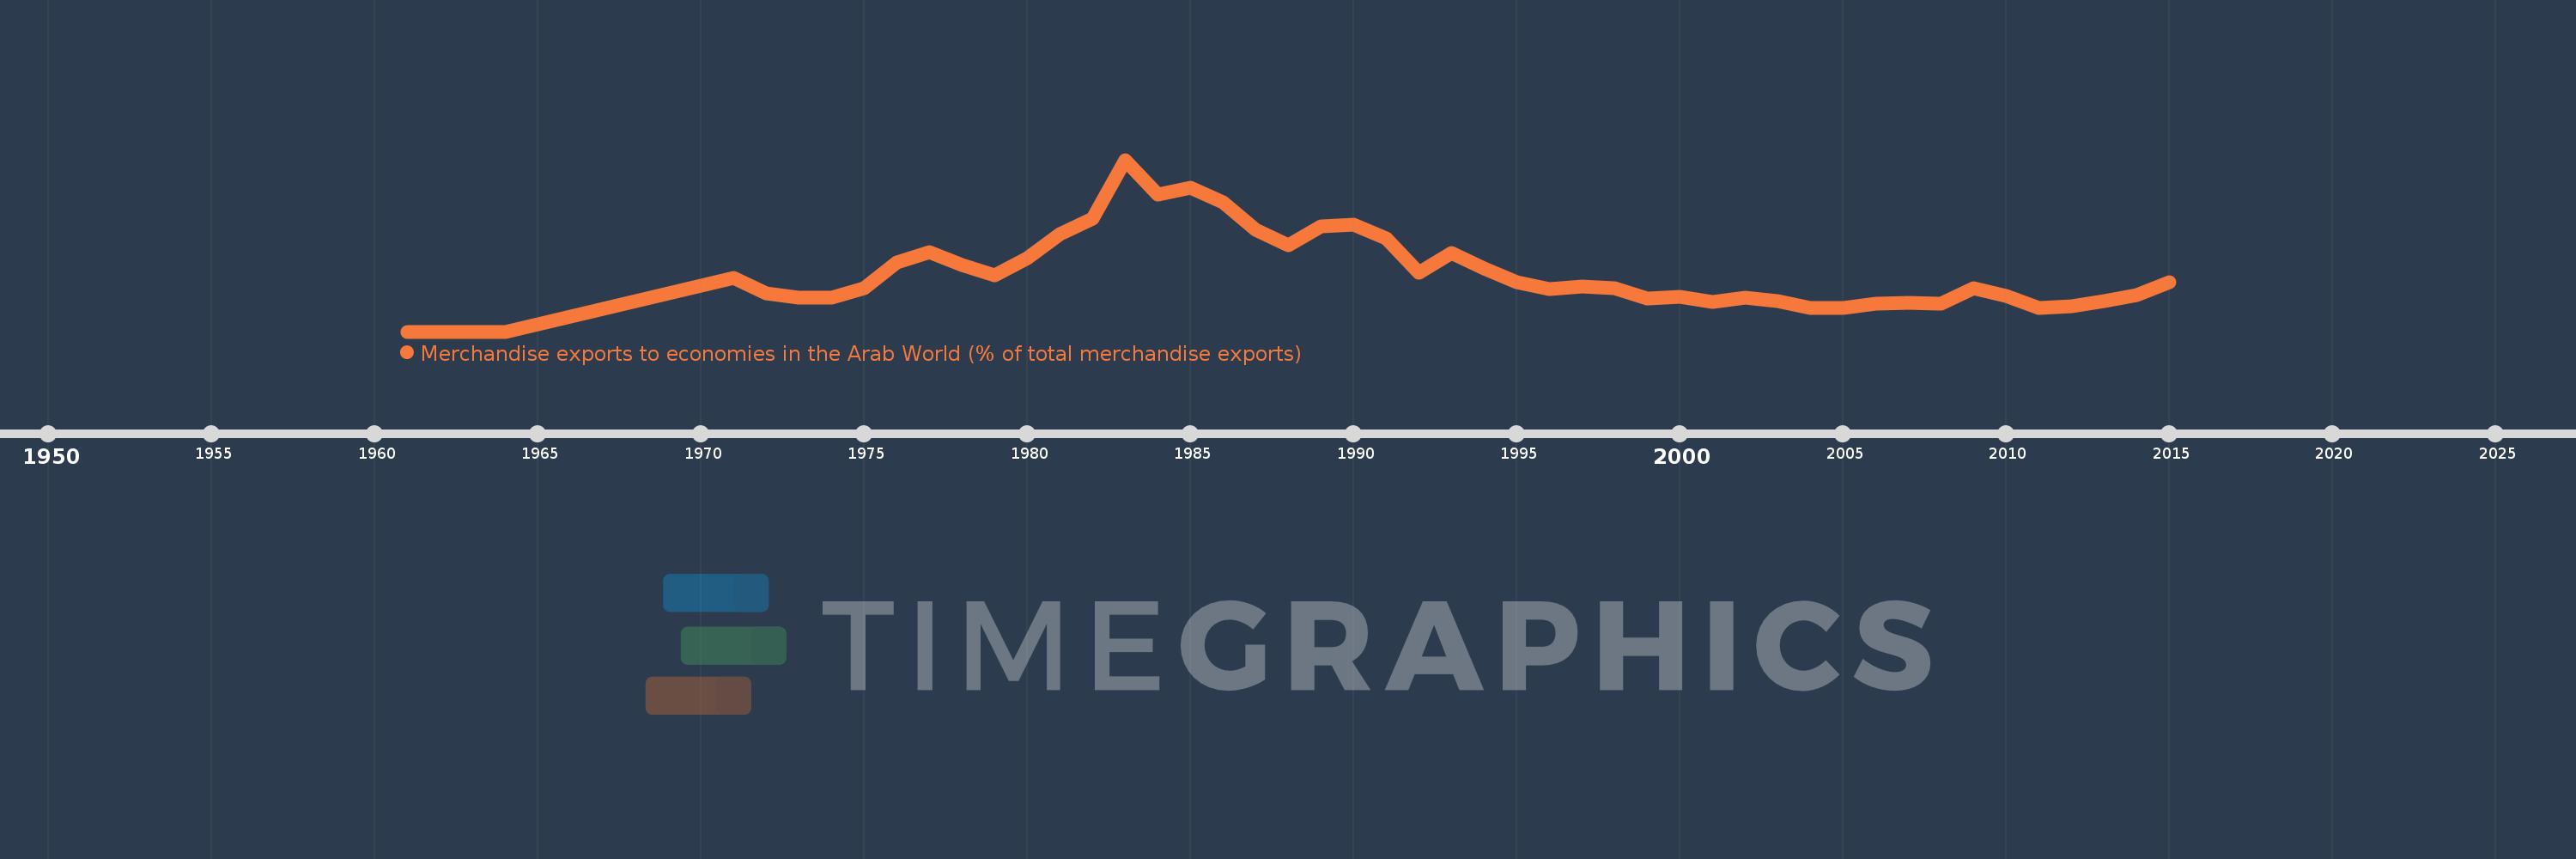
Merchandise exports to economies in the Arab World (% of total merchandise exports)
2015,2014,2013,2012,2011,2010,2009,2008,2007,2006,2005,2004,2003,2002,2001,2000,1999,1998,1997,1996,1995,1994,1993,1992,1991,1990,1989,1988,1987,1986,1985,1984,1983,1982,1981,1980,1979,1978,1977,1976,1975,1974,1973,1972,1971,1964,1963,1962,1961
Estas estatísticas em outros países:
AfghanistanAlbaniaAlgeriaAngolaArab WorldArgentinaArmeniaArubaAustraliaAustriaAzerbaijanBahamas, TheBahrainBangladeshBarbadosBelarusBelgiumBelizeBeninBermudaBoliviaBosnia and HerzegovinaBrazilBrunei DarussalamBulgariaBurkina FasoBurundiCabo VerdeCambodiaCameroonCanadaCaribbean small statesCentral African RepublicCentral Europe and the BalticsChadChileChinaColombiaComorosCongo, Dem. Rep.Congo, Rep.Costa RicaCote d'IvoireCroatiaCubaCyprusCzech RepublicDenmarkDjiboutiDominicaDominican RepublicEarly-demographic dividendEast Asia & PacificEast Asia & Pacific (excluding high income)East Asia & Pacific (IDA & IBRD countries)EcuadorEgypt, Arab Rep.El SalvadorEstoniaEthiopiaEuro areaEurope & Central AsiaEurope & Central Asia (excluding high income)Europe & Central Asia (IDA & IBRD countries)European UnionFijiFinlandFragile and conflict affected situationsFranceGabonGambia, TheGeorgiaGermanyGhanaGreeceGreenlandGrenadaGuatemalaGuineaGuinea-BissauGuyanaHaitiHeavily indebted poor countries (HIPC)High incomeHondurasHong Kong SAR, ChinaHungaryIBRD onlyIcelandIDA & IBRD totalIDA blendIDA onlyIDA totalIndiaIndonesiaIran, Islamic Rep.IraqIrelandIsraelItalyJamaicaJapanJordanKazakhstanKenyaKorea, Dem. People’s Rep.Korea, Rep.KosovoKuwaitKyrgyz RepublicLao PDRLate-demographic dividendLatin America & Caribbean Latin America & Caribbean (excluding high income)Latin America & the Caribbean (IDA & IBRD countries)LatviaLeast developed countries: UN classificationLebanonLiberiaLibyaLithuaniaLow & middle incomeLow incomeLower middle incomeLuxembourgMacao SAR, ChinaMacedonia, FYRMadagascarMalawiMalaysiaMaldivesMaliMaltaMauritaniaMauritiusMexicoMiddle East & North AfricaMiddle East & North Africa (excluding high income)Middle East & North Africa (IDA & IBRD countries)Middle incomeMoldovaMongoliaMontenegroMoroccoMozambiqueMyanmarNepalNetherlandsNew CaledoniaNew ZealandNicaraguaNigerNigeriaNorth AmericaNorwayOECD membersOmanOther small statesPacific island small statesPakistanPanamaPapua New GuineaParaguayPeruPhilippinesPolandPortugalPost-demographic dividendPre-demographic dividendQatarRomaniaRussian FederationRwandaSamoaSaudi ArabiaSenegalSerbiaSeychellesSierra LeoneSingaporeSlovak RepublicSloveniaSmall statesSomaliaSouth AfricaSouth AsiaSouth Asia (IDA & IBRD)SpainSri LankaSt. LuciaSt. Vincent and the GrenadinesSub-Saharan Africa Sub-Saharan Africa (excluding high income)Sub-Saharan Africa (IDA & IBRD countries)SudanSurinameSwedenSwitzerlandSyrian Arab RepublicTajikistanTanzaniaThailandTogoTrinidad and TobagoTunisiaTurkeyTurkmenistanUgandaUkraineUnited Arab EmiratesUnited KingdomUnited StatesUpper middle incomeUruguayUzbekistanVenezuela, RBVietnamWorldYemen, Rep.ZambiaZimbabwe Linha do tempo:
Nesta escala de tempo está apresentado um gráfico de 1961 ano até 2015 ano Poland. Dados de 1960 ano ausente. O número de observações reais por data: 49.
Fonte (nome):
Indicadores de desenvolvimento mundial
Fonte (organização):
World Bank staff estimates based data from International Monetary Fund's Direction of Trade database.
Categorias:
Private Sector, Trade
Foi atualizado:
23 abr 2017 ano
Indicadores de alterações dos valores ao longo dos anos
Máximo:
6.07
1 jan 1983 ano
Na data de observação
Valor
Mudança absoluta
A alteração em relação ao valor anterior
1 jan 1961 ano
0.0
0.0
0.0%
1 jan 1971 ano
1.911
+1.911
%
1 jan 1972 ano
1.346
-0.565
-29.57%
1 jan 1973 ano
1.207
-0.139
-10.3%
1 jan 1974 ano
1.21
+0.003
0.24%
1 jan 1975 ano
1.543
+0.334
27.57%
1 jan 1976 ano
2.444
+0.901
58.35%
1 jan 1977 ano
2.808
+0.364
14.91%
1 jan 1978 ano
2.342
-0.466
-16.59%
1 jan 1979 ano
1.973
-0.369
-15.75%
1 jan 1980 ano
2.604
+0.63
31.94%
1 jan 1981 ano
3.435
+0.831
31.92%
1 jan 1982 ano
4.003
+0.568
16.54%
1 jan 1983 ano
6.07
+2.067
51.63%
1 jan 1984 ano
4.85
-1.22
-20.09%
1 jan 1985 ano
5.078
+0.228
4.7%
1 jan 1986 ano
4.562
-0.516
-10.16%
1 jan 1987 ano
3.6
-0.962
-21.08%
1 jan 1988 ano
3.058
-0.542
-15.07%
1 jan 1989 ano
3.732
+0.675
22.07%
1 jan 1990 ano
3.776
+0.043
1.16%
1 jan 1991 ano
3.289
-0.487
-12.9%
1 jan 1992 ano
2.076
-1.212
-36.87%
1 jan 1993 ano
2.776
+0.7
33.69%
1 jan 1994 ano
2.23
-0.546
-19.67%
1 jan 1995 ano
1.743
-0.487
-21.85%
1 jan 1996 ano
1.515
-0.228
-13.07%
1 jan 1997 ano
1.581
+0.066
4.33%
1 jan 1998 ano
1.545
-0.036
-2.28%
1 jan 1999 ano
1.182
-0.363
-23.49%
1 jan 2000 ano
1.23
+0.049
4.11%
1 jan 2001 ano
1.059
-0.171
-13.92%
1 jan 2002 ano
1.196
+0.137
12.97%
1 jan 2003 ano
1.091
-0.106
-8.85%
1 jan 2004 ano
0.849
-0.242
-22.18%
1 jan 2005 ano
0.837
-0.012
-1.37%
1 jan 2006 ano
0.98
+0.143
17.13%
1 jan 2007 ano
1.003
+0.023
2.3%
1 jan 2008 ano
0.998
-0.005
-0.45%
1 jan 2009 ano
1.526
+0.528
52.84%
1 jan 2010 ano
1.246
-0.28
-18.38%
1 jan 2011 ano
0.842
-0.403
-32.37%
1 jan 2012 ano
0.887
+0.045
5.32%
1 jan 2013 ano
1.087
+0.199
22.48%
1 jan 2014 ano
1.3
+0.214
19.66%
1 jan 2015 ano
1.74
+0.439
33.8%
Classificação de países por estatísticas atuais por anos


Comentários: