29
/pt/
pt
AIzaSyAYiBZKx7MnpbEhh9jyipgxe19OcubqV5w
April 1, 2024
218747
Panama
PAN
true
2
1
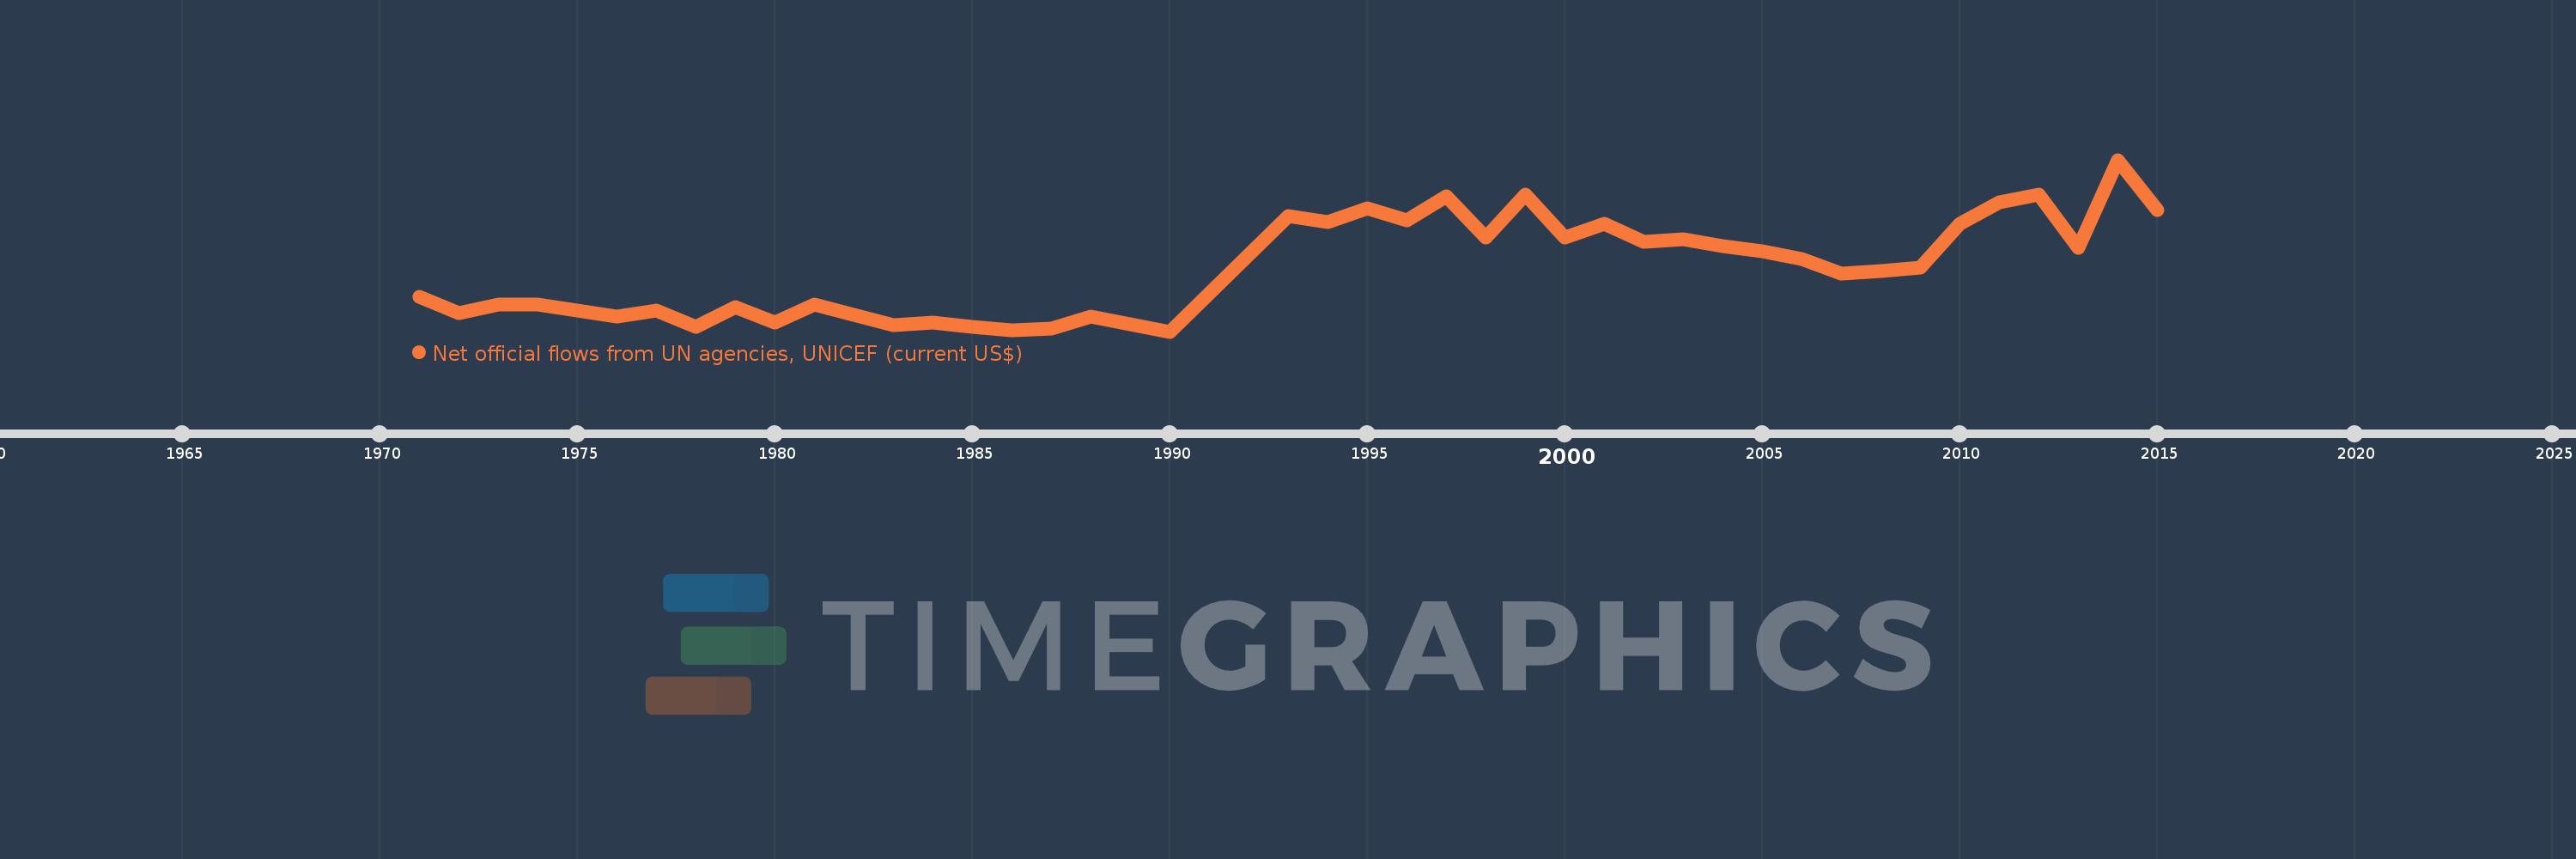
Net official flows from UN agencies, UNICEF (current US$)
2015,2014,2013,2012,2011,2010,2009,2008,2007,2006,2005,2004,2003,2002,2001,2000,1999,1998,1997,1996,1995,1994,1993,1990,1988,1987,1986,1985,1984,1983,1982,1981,1980,1979,1978,1977,1976,1975,1974,1973,1972,1971
Estas estatísticas em outros países:
AfghanistanAlbaniaAlgeriaAngolaAntigua and BarbudaArab WorldArgentinaArmeniaAzerbaijanBahamas, TheBahrainBangladeshBarbadosBelarusBelizeBeninBhutanBoliviaBosnia and HerzegovinaBotswanaBrazilBulgariaBurkina FasoBurundiCabo VerdeCambodiaCameroonCaribbean small statesCentral African RepublicCentral Europe and the BalticsChadChileChinaColombiaComorosCongo, Dem. Rep.Congo, Rep.Costa RicaCote d'IvoireCroatiaCubaCyprusDjiboutiDominicaDominican RepublicEast Asia & PacificEast Asia & Pacific (excluding high income)East Asia & Pacific (IDA & IBRD countries)EcuadorEgypt, Arab Rep.El SalvadorEquatorial GuineaEritreaEthiopiaEuro areaEurope & Central AsiaEurope & Central Asia (excluding high income)Europe & Central Asia (IDA & IBRD countries)European UnionFijiFragile and conflict affected situationsGabonGambia, TheGeorgiaGhanaGrenadaGuatemalaGuineaGuinea-BissauGuyanaHaitiHeavily indebted poor countries (HIPC)High incomeHondurasHong Kong SAR, ChinaIBRD onlyIDA & IBRD totalIDA blendIDA onlyIDA totalIndiaIndonesiaIran, Islamic Rep.IraqJamaicaJordanKazakhstanKenyaKorea, Dem. People’s Rep.Korea, Rep.KosovoKuwaitKyrgyz RepublicLao PDRLatin America & Caribbean Latin America & Caribbean (excluding high income)Latin America & the Caribbean (IDA & IBRD countries)LatviaLeast developed countries: UN classificationLebanonLesothoLiberiaLibyaLow & middle incomeLow incomeLower middle incomeMacedonia, FYRMadagascarMalawiMalaysiaMaldivesMaliMauritaniaMauritiusMexicoMiddle East & North AfricaMiddle East & North Africa (excluding high income)Middle East & North Africa (IDA & IBRD countries)Middle incomeMoldovaMongoliaMontenegroMoroccoMozambiqueMyanmarNamibiaNepalNicaraguaNigerNigeriaNorthern Mariana IslandsOECD membersOmanOther small statesPacific island small statesPakistanPanamaPapua New GuineaParaguayPeruPhilippinesRomaniaRussian FederationRwandaSamoaSao Tome and PrincipeSaudi ArabiaSenegalSerbiaSeychellesSierra LeoneSingaporeSmall statesSomaliaSouth AfricaSouth AsiaSouth Asia (IDA & IBRD)South SudanSri LankaSt. Kitts and NevisSt. LuciaSt. Vincent and the GrenadinesSub-Saharan Africa Sub-Saharan Africa (excluding high income)Sub-Saharan Africa (IDA & IBRD countries)SudanSurinameSwazilandSyrian Arab RepublicTajikistanTanzaniaThailandTimor-LesteTogoTrinidad and TobagoTunisiaTurkeyTurkmenistanUgandaUkraineUnited Arab EmiratesUpper middle incomeUruguayUzbekistanVanuatuVenezuela, RBVietnamWest Bank and GazaWorldYemen, Rep.ZambiaZimbabwe Linha do tempo:
Nesta escala de tempo está apresentado um gráfico de 1971 ano até 2015 ano Panama. Dados de 1970 ano ausente. O número de observações reais por data: 42.
Fonte (nome):
Indicadores de desenvolvimento mundial
Fonte (organização):
Development Assistance Committee of the Organisation for Economic Co-operation and Development, Geographical Distribution of Financial Flows to Developing Countries, Development Co-operation Report, and International Development Statistics database. Data are available online at: www.oecd.org/dac/stats/idsonline.
Categorias:
Aid Effectiveness
Foi atualizado:
23 abr 2017 ano
Indicadores de alterações dos valores ao longo dos anos
Mínimo:
20.0 mil
1 jan 1990 ano
Máximo:
1.15 milhões
1 jan 2014 ano
Na data de observação
Valor
Mudança absoluta
A alteração em relação ao valor anterior
1 jan 1971 ano
250.0 mil
+250.0 mil
0.0%
1 jan 1972 ano
140.0 mil
-110.0 mil
-44.0%
1 jan 1973 ano
200.0 mil
+60.0 mil
42.86%
1 jan 1974 ano
200.0 mil
0.0
0.0%
1 jan 1975 ano
160.0 mil
-40.0 mil
-20.0%
1 jan 1976 ano
120.0 mil
-40.0 mil
-25.0%
1 jan 1977 ano
160.0 mil
+40.0 mil
33.33%
1 jan 1978 ano
50.0 mil
-110.0 mil
-68.75%
1 jan 1979 ano
180.0 mil
+130.0 mil
260.0%
1 jan 1980 ano
80.0 mil
-100.0 mil
-55.56%
1 jan 1981 ano
200.0 mil
+120.0 mil
150.0%
1 jan 1982 ano
130.0 mil
-70.0 mil
-35.0%
1 jan 1983 ano
60.0 mil
-70.0 mil
-53.85%
1 jan 1984 ano
80.0 mil
+20.0 mil
33.33%
1 jan 1985 ano
50.0 mil
-30.0 mil
-37.5%
1 jan 1986 ano
30.0 mil
-20.0 mil
-40.0%
1 jan 1987 ano
40.0 mil
+10.0 mil
33.33%
1 jan 1988 ano
120.0 mil
+80.0 mil
200.0%
1 jan 1990 ano
20.0 mil
-100.0 mil
-83.33%
1 jan 1993 ano
780.0 mil
+760.0 mil
3.8 mil%
1 jan 1994 ano
740.0 mil
-40.0 mil
-5.13%
1 jan 1995 ano
830.0 mil
+90.0 mil
12.16%
1 jan 1996 ano
750.0 mil
-80.0 mil
-9.64%
1 jan 1997 ano
910.0 mil
+160.0 mil
21.33%
1 jan 1998 ano
640.0 mil
-270.0 mil
-29.67%
1 jan 1999 ano
920.0 mil
+280.0 mil
43.75%
1 jan 2000 ano
640.0 mil
-280.0 mil
-30.43%
1 jan 2001 ano
730.0 mil
+90.0 mil
14.06%
1 jan 2002 ano
610.0 mil
-120.0 mil
-16.44%
1 jan 2003 ano
630.0 mil
+20.0 mil
3.28%
1 jan 2004 ano
580.0 mil
-50.0 mil
-7.94%
1 jan 2005 ano
550.0 mil
-30.0 mil
-5.17%
1 jan 2006 ano
500.0 mil
-50.0 mil
-9.09%
1 jan 2007 ano
400.0 mil
-100.0 mil
-20.0%
1 jan 2008 ano
420.0 mil
+20.0 mil
5.0%
1 jan 2009 ano
440.0 mil
+20.0 mil
4.76%
1 jan 2010 ano
730.0 mil
+290.0 mil
65.91%
1 jan 2011 ano
870.0 mil
+140.0 mil
19.18%
1 jan 2012 ano
920.0 mil
+50.0 mil
5.75%
1 jan 2013 ano
570.0 mil
-350.0 mil
-38.04%
1 jan 2014 ano
1.15 milhões
+580.0 mil
101.75%
1 jan 2015 ano
820.0 mil
-330.0 mil
-28.7%
Classificação de países por estatísticas atuais por anos


Comentários: