29
/pt/
pt
AIzaSyAYiBZKx7MnpbEhh9jyipgxe19OcubqV5w
April 1, 2024
213894
Northern Mariana Islands
MNP
true
2
1
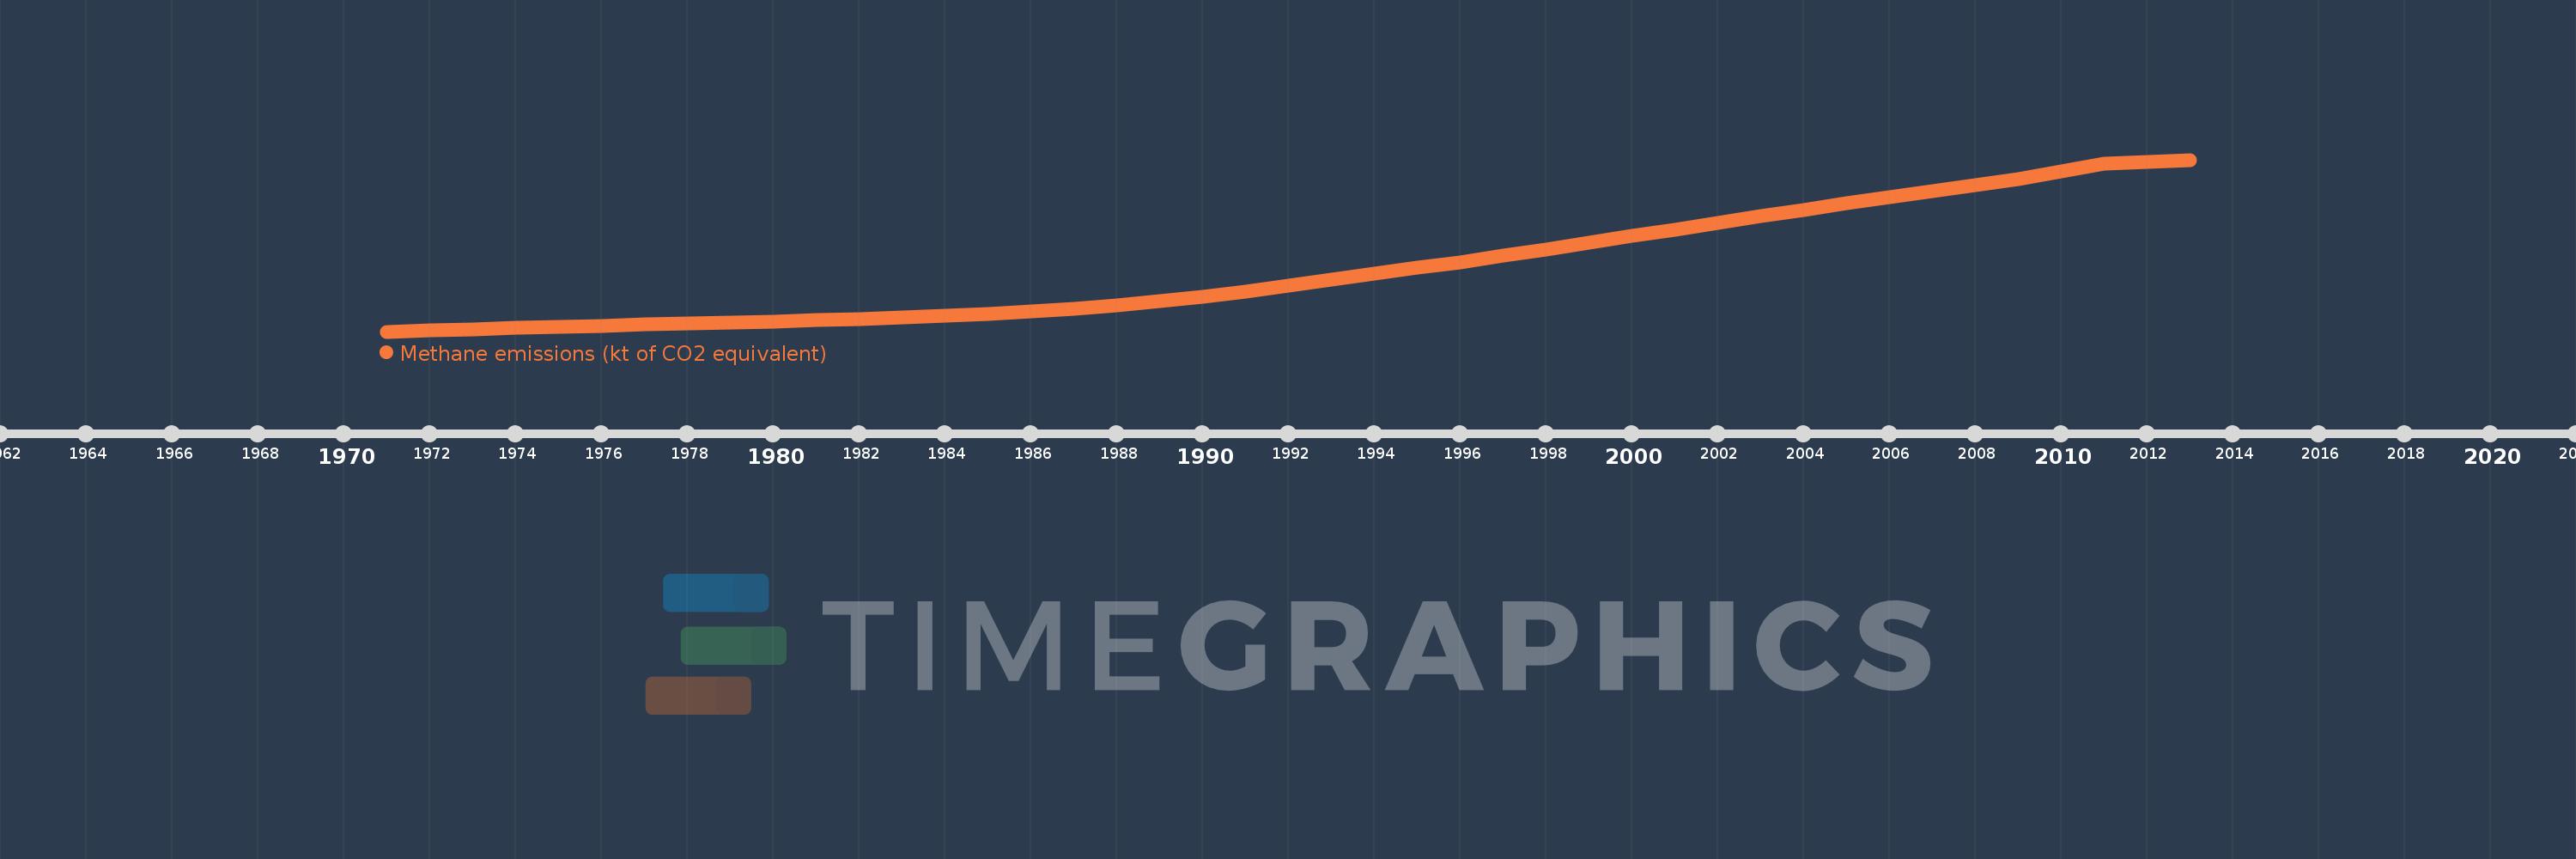
Methane emissions (kt of CO2 equivalent)
2013,2012,2011,2010,2009,2008,2007,2006,2005,2004,2003,2002,2001,2000,1999,1998,1997,1996,1995,1994,1993,1992,1991,1990,1989,1988,1987,1986,1985,1984,1983,1982,1981,1980,1979,1978,1977,1976,1975,1974,1973,1972,1971
Estas estatísticas em outros países:
AfghanistanAlbaniaAlgeriaAmerican SamoaAngolaAntigua and BarbudaArab WorldArgentinaArmeniaArubaAustraliaAustriaAzerbaijanBahamas, TheBahrainBangladeshBarbadosBelarusBelgiumBelizeBeninBermudaBhutanBoliviaBosnia and HerzegovinaBotswanaBrazilBritish Virgin IslandsBrunei DarussalamBulgariaBurkina FasoBurundiCabo VerdeCambodiaCameroonCanadaCaribbean small statesCayman IslandsCentral African RepublicCentral Europe and the BalticsChadChileChinaColombiaComorosCongo, Dem. Rep.Congo, Rep.Costa RicaCote d'IvoireCroatiaCubaCyprusCzech RepublicDenmarkDjiboutiDominicaDominican RepublicEarly-demographic dividendEast Asia & PacificEast Asia & Pacific (excluding high income)East Asia & Pacific (IDA & IBRD countries)EcuadorEgypt, Arab Rep.El SalvadorEquatorial GuineaEritreaEstoniaEthiopiaEuro areaEurope & Central AsiaEurope & Central Asia (excluding high income)Europe & Central Asia (IDA & IBRD countries)European UnionFaroe IslandsFijiFinlandFragile and conflict affected situationsFranceFrench PolynesiaGabonGambia, TheGeorgiaGermanyGhanaGibraltarGreeceGreenlandGrenadaGuamGuatemalaGuineaGuinea-BissauGuyanaHaitiHeavily indebted poor countries (HIPC)High incomeHondurasHong Kong SAR, ChinaHungaryIBRD onlyIcelandIDA & IBRD totalIDA blendIDA onlyIDA totalIndiaIndonesiaIran, Islamic Rep.IraqIrelandIsraelItalyJamaicaJapanJordanKazakhstanKenyaKiribatiKorea, Dem. People’s Rep.Korea, Rep.KosovoKuwaitKyrgyz RepublicLao PDRLate-demographic dividendLatin America & Caribbean Latin America & Caribbean (excluding high income)Latin America & the Caribbean (IDA & IBRD countries)LatviaLeast developed countries: UN classificationLebanonLesothoLiberiaLibyaLithuaniaLow & middle incomeLow incomeLower middle incomeLuxembourgMacao SAR, ChinaMacedonia, FYRMadagascarMalawiMalaysiaMaldivesMaliMaltaMarshall IslandsMauritaniaMauritiusMexicoMicronesia, Fed. Sts.Middle East & North AfricaMiddle East & North Africa (excluding high income)Middle East & North Africa (IDA & IBRD countries)Middle incomeMoldovaMongoliaMontenegroMoroccoMozambiqueMyanmarNamibiaNauruNepalNetherlandsNew CaledoniaNew ZealandNicaraguaNigerNigeriaNorth AmericaNorthern Mariana IslandsNorwayOECD membersOmanOther small statesPacific island small statesPakistanPalauPanamaPapua New GuineaParaguayPeruPhilippinesPolandPortugalPost-demographic dividendPre-demographic dividendPuerto RicoQatarRomaniaRussian FederationRwandaSamoaSao Tome and PrincipeSaudi ArabiaSenegalSerbiaSeychellesSierra LeoneSingaporeSlovak RepublicSloveniaSmall statesSolomon IslandsSomaliaSouth AfricaSouth AsiaSouth Asia (IDA & IBRD)SpainSri LankaSt. Kitts and NevisSt. LuciaSt. Vincent and the GrenadinesSub-Saharan Africa Sub-Saharan Africa (excluding high income)Sub-Saharan Africa (IDA & IBRD countries)SudanSurinameSwazilandSwedenSwitzerlandSyrian Arab RepublicTajikistanTanzaniaThailandTimor-LesteTogoTongaTrinidad and TobagoTunisiaTurkeyTurkmenistanTurks and Caicos IslandsTuvaluUgandaUkraineUnited Arab EmiratesUnited KingdomUnited StatesUpper middle incomeUruguayUzbekistanVanuatuVenezuela, RBVietnamVirgin Islands (U.S.)WorldYemen, Rep.ZambiaZimbabwe Linha do tempo:
Nesta escala de tempo está apresentado um gráfico de 1971 ano até 2013 ano Northern Mariana Islands. Dados de 1970 ano ausente. O número de observações reais por data: 43.
Fonte (nome):
Indicadores de desenvolvimento mundial
Fonte (organização):
European Commission, Joint Research Centre (JRC)/Netherlands Environmental Assessment Agency (PBL). Emission Database for Global Atmospheric Research (EDGAR): http://edgar.jrc.ec.europa.eu/
Categorias:
Climate Change, Environment
Foi atualizado:
23 abr 2017 ano
Indicadores de alterações dos valores ao longo dos anos
Mínimo:
2.48
1 jan 1971 ano
Máximo:
12.364
1 jan 2013 ano
Na data de observação
Valor
Mudança absoluta
A alteração em relação ao valor anterior
1 jan 1971 ano
2.48
+2.48
0.0%
1 jan 1972 ano
2.551
+0.071
2.85%
1 jan 1973 ano
2.619
+0.068
2.65%
1 jan 1974 ano
2.683
+0.064
2.45%
1 jan 1975 ano
2.75
+0.067
2.5%
1 jan 1976 ano
2.817
+0.067
2.43%
1 jan 1977 ano
2.882
+0.066
2.33%
1 jan 1978 ano
2.945
+0.063
2.17%
1 jan 1979 ano
3.007
+0.062
2.11%
1 jan 1980 ano
3.069
+0.062
2.07%
1 jan 1981 ano
3.139
+0.07
2.27%
1 jan 1982 ano
3.21
+0.071
2.27%
1 jan 1983 ano
3.294
+0.084
2.62%
1 jan 1984 ano
3.384
+0.09
2.74%
1 jan 1985 ano
3.496
+0.112
3.31%
1 jan 1986 ano
3.633
+0.136
3.9%
1 jan 1987 ano
3.8
+0.168
4.62%
1 jan 1988 ano
4.002
+0.201
5.3%
1 jan 1989 ano
4.235
+0.233
5.83%
1 jan 1990 ano
4.498
+0.263
6.21%
1 jan 1991 ano
4.786
+0.287
6.39%
1 jan 1992 ano
5.117
+0.331
6.92%
1 jan 1993 ano
5.454
+0.337
6.59%
1 jan 1994 ano
5.796
+0.342
6.27%
1 jan 1995 ano
6.145
+0.349
6.03%
1 jan 1996 ano
6.464
+0.319
5.19%
1 jan 1997 ano
6.838
+0.374
5.78%
1 jan 1998 ano
7.221
+0.383
5.61%
1 jan 1999 ano
7.603
+0.382
5.28%
1 jan 2000 ano
7.984
+0.381
5.02%
1 jan 2001 ano
8.357
+0.373
4.68%
1 jan 2002 ano
8.738
+0.381
4.56%
1 jan 2003 ano
9.114
+0.375
4.3%
1 jan 2004 ano
9.484
+0.37
4.06%
1 jan 2005 ano
9.854
+0.371
3.91%
1 jan 2006 ano
10.224
+0.37
3.75%
1 jan 2007 ano
10.54
+0.316
3.09%
1 jan 2008 ano
10.887
+0.347
3.29%
1 jan 2009 ano
11.268
+0.381
3.5%
1 jan 2010 ano
11.676
+0.409
3.63%
1 jan 2011 ano
12.121
+0.445
3.81%
1 jan 2012 ano
12.242
+0.121
1.0%
1 jan 2013 ano
12.364
+0.121
0.99%
Classificação de países por estatísticas atuais por anos


Comentários: