29
/pt/
pt
AIzaSyAYiBZKx7MnpbEhh9jyipgxe19OcubqV5w
April 1, 2024
212594
Nigeria
NGA
true
2
1
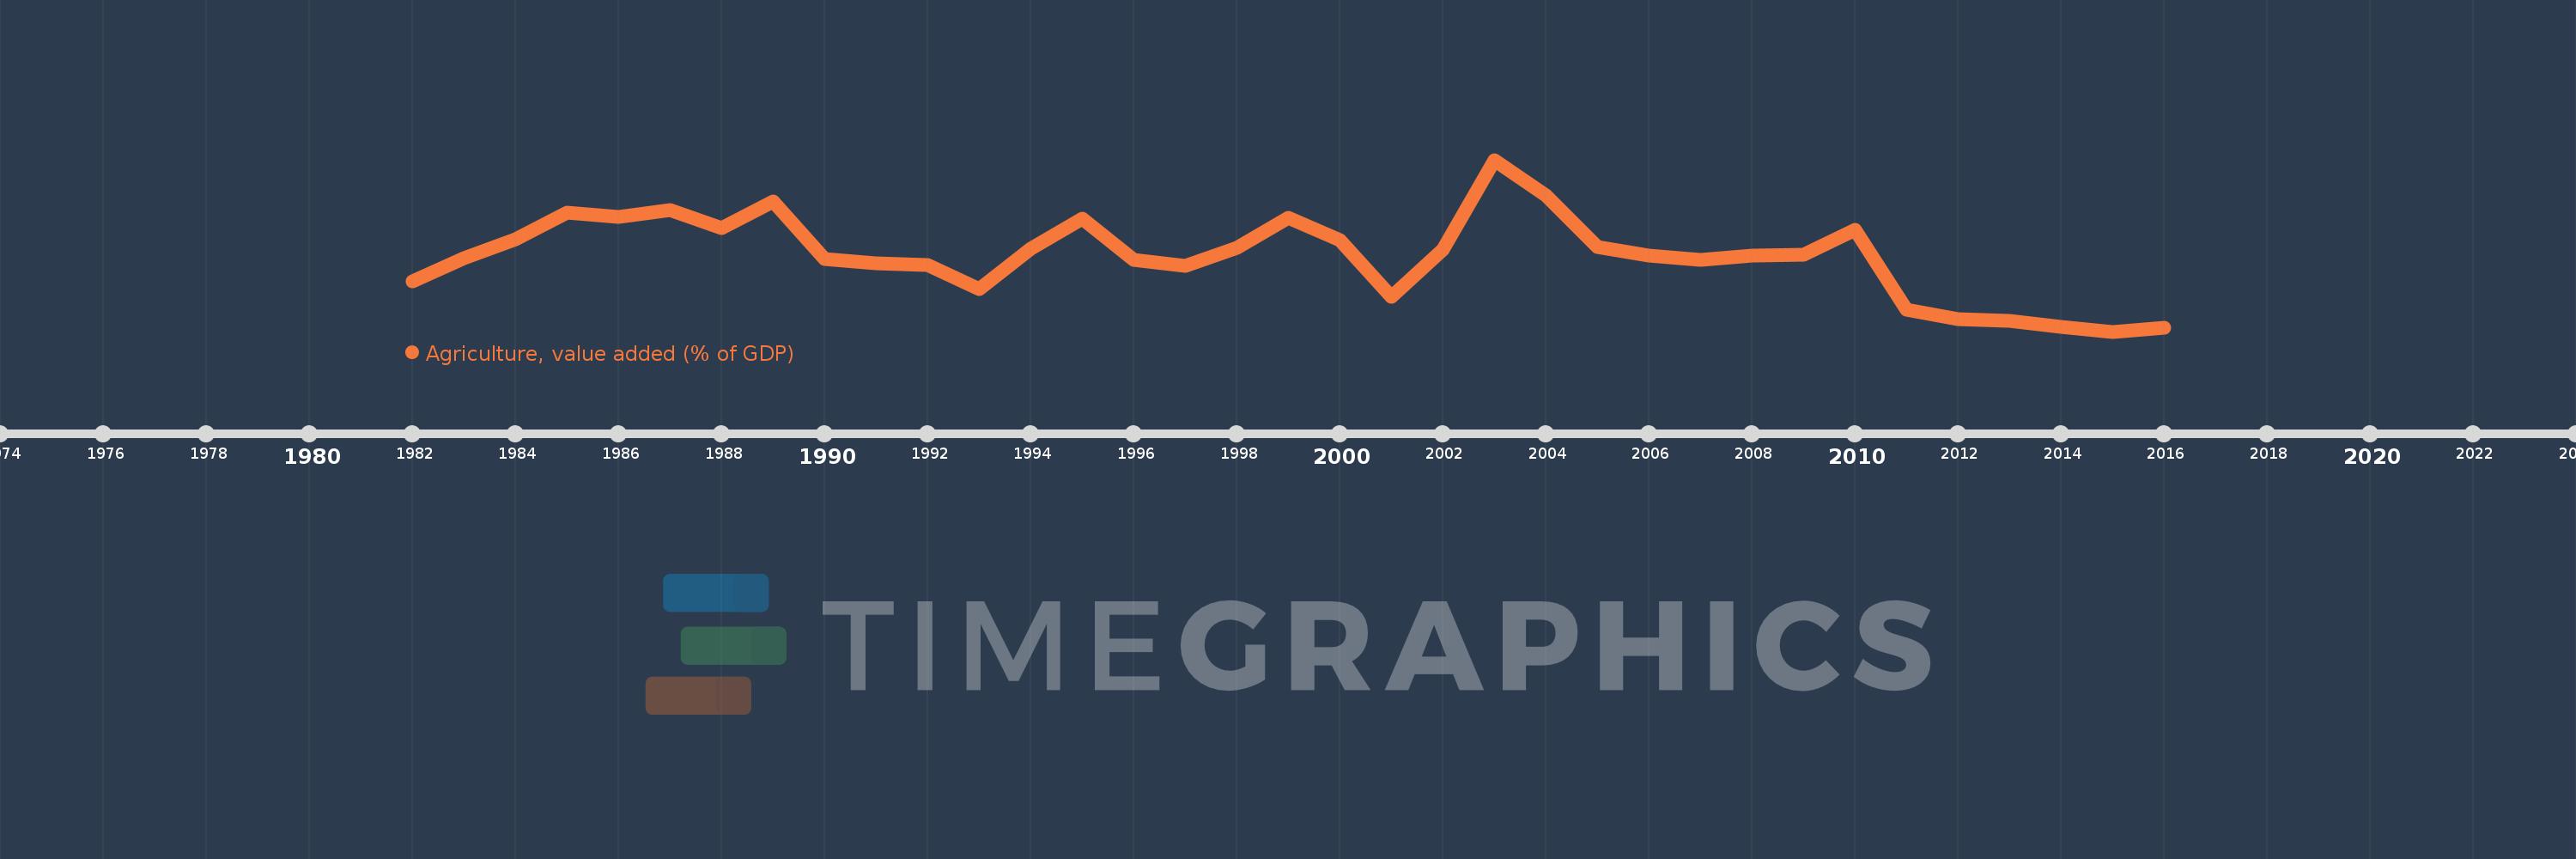
Agriculture, value added (% of GDP)
2016,2015,2014,2013,2012,2011,2010,2009,2008,2007,2006,2005,2004,2003,2002,2001,2000,1999,1998,1997,1996,1995,1994,1993,1992,1991,1990,1989,1988,1987,1986,1985,1984,1983,1982
Estas estatísticas em outros países:
AfghanistanAlbaniaAlgeriaAndorraAngolaAntigua and BarbudaArab WorldArgentinaArmeniaArubaAustraliaAustriaAzerbaijanBahamas, TheBahrainBangladeshBarbadosBelarusBelgiumBelizeBeninBermudaBhutanBoliviaBosnia and HerzegovinaBotswanaBrazilBrunei DarussalamBulgariaBurkina FasoBurundiCabo VerdeCambodiaCameroonCanadaCaribbean small statesCayman IslandsCentral African RepublicCentral Europe and the BalticsChadChileChinaColombiaComorosCongo, Dem. Rep.Congo, Rep.Costa RicaCote d'IvoireCroatiaCubaCyprusCzech RepublicDenmarkDjiboutiDominicaDominican RepublicEarly-demographic dividendEast Asia & PacificEast Asia & Pacific (excluding high income)East Asia & Pacific (IDA & IBRD countries)EcuadorEgypt, Arab Rep.El SalvadorEquatorial GuineaEritreaEstoniaEthiopiaEuro areaEurope & Central AsiaEurope & Central Asia (excluding high income)Europe & Central Asia (IDA & IBRD countries)European UnionFijiFinlandFragile and conflict affected situationsFranceFrench PolynesiaGabonGambia, TheGeorgiaGermanyGhanaGreeceGrenadaGuatemalaGuineaGuinea-BissauGuyanaHeavily indebted poor countries (HIPC)High incomeHondurasHong Kong SAR, ChinaHungaryIBRD onlyIcelandIDA & IBRD totalIDA blendIDA onlyIDA totalIndiaIndonesiaIran, Islamic Rep.IrelandItalyJamaicaJapanJordanKazakhstanKenyaKiribatiKorea, Rep.KosovoKuwaitKyrgyz RepublicLao PDRLate-demographic dividendLatin America & Caribbean Latin America & Caribbean (excluding high income)Latin America & the Caribbean (IDA & IBRD countries)LatviaLeast developed countries: UN classificationLebanonLesothoLibyaLithuaniaLow & middle incomeLow incomeLower middle incomeLuxembourgMacao SAR, ChinaMacedonia, FYRMadagascarMalawiMalaysiaMaldivesMaliMaltaMarshall IslandsMauritaniaMauritiusMexicoMicronesia, Fed. Sts.Middle East & North AfricaMiddle East & North Africa (excluding high income)Middle East & North Africa (IDA & IBRD countries)Middle incomeMoldovaMongoliaMontenegroMoroccoMozambiqueMyanmarNamibiaNepalNetherlandsNew CaledoniaNew ZealandNicaraguaNigerNigeriaNorth AmericaNorwayOECD membersOmanOther small statesPacific island small statesPakistanPalauPanamaPapua New GuineaParaguayPeruPhilippinesPolandPortugalPost-demographic dividendPre-demographic dividendPuerto RicoQatarRomaniaRussian FederationRwandaSao Tome and PrincipeSaudi ArabiaSenegalSerbiaSeychellesSierra LeoneSingaporeSlovak RepublicSloveniaSmall statesSolomon IslandsSomaliaSouth AfricaSouth AsiaSouth Asia (IDA & IBRD)SpainSri LankaSt. Kitts and NevisSt. LuciaSt. Vincent and the GrenadinesSub-Saharan Africa Sub-Saharan Africa (excluding high income)Sub-Saharan Africa (IDA & IBRD countries)SudanSurinameSwazilandSwedenSwitzerlandSyrian Arab RepublicTajikistanTanzaniaThailandTimor-LesteTogoTongaTrinidad and TobagoTunisiaTurkeyTurkmenistanTuvaluUgandaUkraineUnited KingdomUnited StatesUpper middle incomeUruguayUzbekistanVanuatuVenezuela, RBVietnamWest Bank and GazaWorldYemen, Rep.ZambiaZimbabwe Linha do tempo:
Nesta escala de tempo está apresentado um gráfico de 1982 ano até 2016 ano Nigeria. Dados de 1981 ano ausente. O número de observações reais por data: 35.
Fonte (nome):
Indicadores de desenvolvimento mundial
Fonte (organização):
World Bank national accounts data, and OECD National Accounts data files.
Categorias:
Agriculture & Rural Development, Economy & Growth, Climate Change
Foi atualizado:
23 abr 2017 ano
Indicadores de alterações dos valores ao longo dos anos
Mínimo:
20.236
1 jan 2015 ano
Máximo:
48.566
1 jan 2003 ano
Na data de observação
Valor
Mudança absoluta
A alteração em relação ao valor anterior
1 jan 1982 ano
28.518
+28.518
0.0%
1 jan 1983 ano
32.414
+3.896
13.66%
1 jan 1984 ano
35.47
+3.056
9.43%
1 jan 1985 ano
39.917
+4.447
12.54%
1 jan 1986 ano
39.207
-0.709
-1.78%
1 jan 1987 ano
40.331
+1.123
2.86%
1 jan 1988 ano
37.258
-3.072
-7.62%
1 jan 1989 ano
41.647
+4.388
11.78%
1 jan 1990 ano
32.156
-9.491
-22.79%
1 jan 1991 ano
31.525
-0.631
-1.96%
1 jan 1992 ano
31.224
-0.3
-0.95%
1 jan 1993 ano
27.267
-3.958
-12.68%
1 jan 1994 ano
33.9
+6.634
24.33%
1 jan 1995 ano
38.811
+4.911
14.49%
1 jan 1996 ano
32.061
-6.75
-17.39%
1 jan 1997 ano
31.134
-0.927
-2.89%
1 jan 1998 ano
34.031
+2.898
9.31%
1 jan 1999 ano
39.048
+5.016
14.74%
1 jan 2000 ano
35.306
-3.741
-9.58%
1 jan 2001 ano
26.034
-9.272
-26.26%
1 jan 2002 ano
33.754
+7.72
29.65%
1 jan 2003 ano
48.566
+14.812
43.88%
1 jan 2004 ano
42.707
-5.859
-12.06%
1 jan 2005 ano
34.21
-8.497
-19.9%
1 jan 2006 ano
32.755
-1.455
-4.25%
1 jan 2007 ano
31.999
-0.757
-2.31%
1 jan 2008 ano
32.714
+0.715
2.24%
1 jan 2009 ano
32.85
+0.136
0.42%
1 jan 2010 ano
37.05
+4.2
12.79%
1 jan 2011 ano
23.894
-13.156
-35.51%
1 jan 2012 ano
22.289
-1.605
-6.72%
1 jan 2013 ano
22.054
-0.235
-1.05%
1 jan 2014 ano
20.996
-1.058
-4.8%
1 jan 2015 ano
20.236
-0.761
-3.62%
1 jan 2016 ano
20.858
+0.623
3.08%
Classificação de países por estatísticas atuais por anos


Comentários: