29
/pt/
pt
AIzaSyAYiBZKx7MnpbEhh9jyipgxe19OcubqV5w
April 1, 2024
212563
Nigeria
NGA
true
2
1
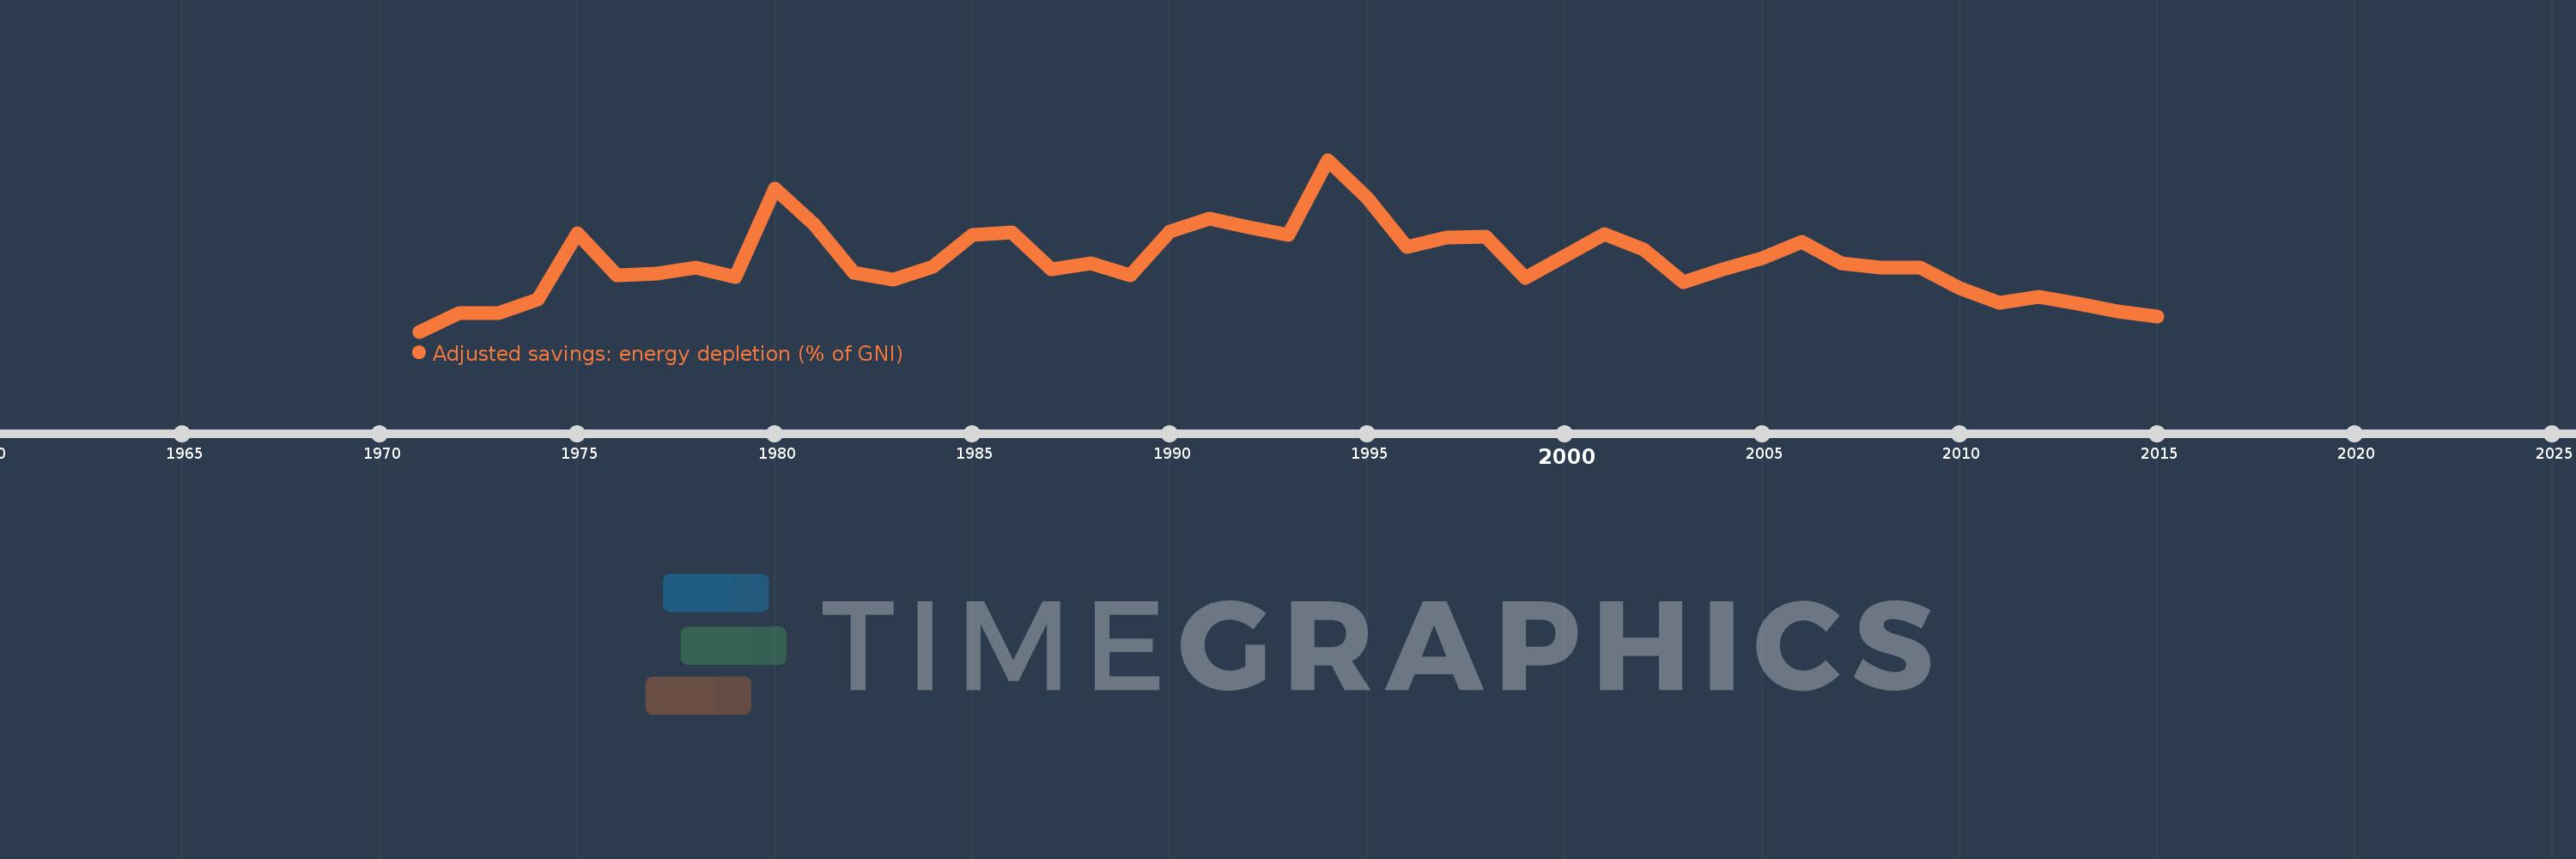
Adjusted savings: energy depletion (% of GNI)
2015,2014,2013,2012,2011,2010,2009,2008,2007,2006,2005,2004,2003,2002,2001,1999,1998,1997,1996,1995,1994,1993,1992,1991,1990,1989,1988,1987,1986,1985,1984,1983,1982,1981,1980,1979,1978,1977,1976,1975,1974,1973,1972,1971
Estas estatísticas em outros países:
AfghanistanAlbaniaAlgeriaAmerican SamoaAndorraAngolaAntigua and BarbudaArab WorldArgentinaArmeniaAustraliaAustriaAzerbaijanBahamas, TheBahrainBangladeshBarbadosBelarusBelgiumBelizeBeninBermudaBhutanBoliviaBosnia and HerzegovinaBotswanaBrazilBrunei DarussalamBulgariaBurkina FasoBurundiCabo VerdeCambodiaCameroonCanadaCaribbean small statesCentral African RepublicCentral Europe and the BalticsChadChannel IslandsChileChinaColombiaComorosCongo, Dem. Rep.Congo, Rep.Costa RicaCote d'IvoireCroatiaCubaCyprusCzech RepublicDenmarkDjiboutiDominicaDominican RepublicEarly-demographic dividendEast Asia & PacificEast Asia & Pacific (excluding high income)East Asia & Pacific (IDA & IBRD countries)EcuadorEgypt, Arab Rep.El SalvadorEquatorial GuineaEritreaEstoniaEthiopiaEuro areaEurope & Central AsiaEurope & Central Asia (excluding high income)Europe & Central Asia (IDA & IBRD countries)European UnionFaroe IslandsFijiFinlandFragile and conflict affected situationsFranceFrench PolynesiaGabonGambia, TheGeorgiaGermanyGhanaGreeceGreenlandGrenadaGuatemalaGuineaGuinea-BissauGuyanaHaitiHeavily indebted poor countries (HIPC)High incomeHondurasHong Kong SAR, ChinaHungaryIBRD onlyIcelandIDA & IBRD totalIDA blendIDA onlyIDA totalIndiaIndonesiaIran, Islamic Rep.IraqIrelandIsle of ManIsraelItalyJamaicaJapanJordanKazakhstanKenyaKiribatiKorea, Rep.KosovoKuwaitKyrgyz RepublicLao PDRLate-demographic dividendLatin America & Caribbean Latin America & Caribbean (excluding high income)Latin America & the Caribbean (IDA & IBRD countries)LatviaLeast developed countries: UN classificationLebanonLesothoLiberiaLibyaLiechtensteinLithuaniaLow & middle incomeLow incomeLower middle incomeLuxembourgMacao SAR, ChinaMacedonia, FYRMadagascarMalawiMalaysiaMaldivesMaliMaltaMarshall IslandsMauritaniaMauritiusMexicoMicronesia, Fed. Sts.Middle East & North AfricaMiddle East & North Africa (excluding high income)Middle East & North Africa (IDA & IBRD countries)Middle incomeMoldovaMonacoMongoliaMontenegroMoroccoMozambiqueMyanmarNamibiaNepalNetherlandsNew CaledoniaNew ZealandNicaraguaNigerNigeriaNorth AmericaNorwayOECD membersOmanOther small statesPacific island small statesPakistanPalauPanamaPapua New GuineaParaguayPeruPhilippinesPolandPortugalPost-demographic dividendPre-demographic dividendPuerto RicoQatarRomaniaRussian FederationRwandaSamoaSan MarinoSao Tome and PrincipeSaudi ArabiaSenegalSerbiaSeychellesSierra LeoneSingaporeSlovak RepublicSloveniaSmall statesSolomon IslandsSomaliaSouth AfricaSouth AsiaSouth Asia (IDA & IBRD)South SudanSpainSri LankaSt. Kitts and NevisSt. LuciaSt. Vincent and the GrenadinesSub-Saharan Africa Sub-Saharan Africa (excluding high income)Sub-Saharan Africa (IDA & IBRD countries)SudanSurinameSwazilandSwedenSwitzerlandSyrian Arab RepublicTajikistanTanzaniaThailandTimor-LesteTogoTongaTrinidad and TobagoTunisiaTurkeyTurkmenistanTuvaluUgandaUkraineUnited Arab EmiratesUnited KingdomUnited StatesUpper middle incomeUruguayUzbekistanVanuatuVenezuela, RBVietnamVirgin Islands (U.S.)West Bank and GazaWorldYemen, Rep.ZambiaZimbabwe Linha do tempo:
Nesta escala de tempo está apresentado um gráfico de 1971 ano até 2015 ano Nigeria. Dados de 1970 ano ausente. O número de observações reais por data: 44.
Fonte (nome):
Indicadores de desenvolvimento mundial
Fonte (organização):
World Bank staff estimates based on sources and methods in World Bank's "The Changing Wealth of Nations: Measuring Sustainable Development in the New Millennium" (2011).
Categorias:
Economy & Growth, Energy & Mining, Environment
Foi atualizado:
23 abr 2017 ano
Indicadores de alterações dos valores ao longo dos anos
Mínimo:
2.02
1 jan 1971 ano
Máximo:
45.67
1 jan 1994 ano
Na data de observação
Valor
Mudança absoluta
A alteração em relação ao valor anterior
1 jan 1971 ano
2.02
+2.02
0.0%
1 jan 1972 ano
6.765
+4.745
234.94%
1 jan 1973 ano
6.776
+0.011
0.17%
1 jan 1974 ano
10.104
+3.328
49.11%
1 jan 1975 ano
27.06
+16.956
167.81%
1 jan 1976 ano
16.361
-10.698
-39.54%
1 jan 1977 ano
16.847
+0.486
2.97%
1 jan 1978 ano
18.306
+1.459
8.66%
1 jan 1979 ano
15.811
-2.495
-13.63%
1 jan 1980 ano
38.363
+22.552
142.64%
1 jan 1981 ano
29.125
-9.238
-24.08%
1 jan 1982 ano
17.077
-12.048
-41.37%
1 jan 1983 ano
15.237
-1.84
-10.77%
1 jan 1984 ano
18.59
+3.353
22.0%
1 jan 1985 ano
26.662
+8.072
43.42%
1 jan 1986 ano
27.287
+0.625
2.34%
1 jan 1987 ano
17.821
-9.466
-34.69%
1 jan 1988 ano
19.478
+1.657
9.3%
1 jan 1989 ano
16.39
-3.088
-15.85%
1 jan 1990 ano
27.386
+10.996
67.09%
1 jan 1991 ano
30.734
+3.348
12.22%
1 jan 1992 ano
28.57
-2.163
-7.04%
1 jan 1993 ano
26.515
-2.056
-7.19%
1 jan 1994 ano
45.67
+19.155
72.24%
1 jan 1995 ano
35.888
-9.781
-21.42%
1 jan 1996 ano
23.601
-12.287
-34.24%
1 jan 1997 ano
25.986
+2.384
10.1%
1 jan 1998 ano
26.085
+0.099
0.38%
1 jan 1999 ano
15.628
-10.456
-40.09%
1 jan 2001 ano
26.739
+11.11
71.09%
1 jan 2002 ano
22.95
-3.788
-14.17%
1 jan 2003 ano
14.5
-8.45
-36.82%
1 jan 2004 ano
17.879
+3.378
23.3%
1 jan 2005 ano
20.66
+2.781
15.56%
1 jan 2006 ano
24.877
+4.217
20.41%
1 jan 2007 ano
19.408
-5.469
-21.98%
1 jan 2008 ano
18.339
-1.069
-5.51%
1 jan 2009 ano
18.285
-0.054
-0.3%
1 jan 2010 ano
13.135
-5.15
-28.16%
1 jan 2011 ano
9.296
-3.839
-29.23%
1 jan 2012 ano
10.758
+1.462
15.73%
1 jan 2013 ano
9.007
-1.751
-16.28%
1 jan 2014 ano
7.222
-1.785
-19.82%
1 jan 2015 ano
5.762
-1.46
-20.21%
Classificação de países por estatísticas atuais por anos


Comentários: