29
/pt/
pt
AIzaSyAYiBZKx7MnpbEhh9jyipgxe19OcubqV5w
April 1, 2024
208172
Netherlands
NLD
true
2
1
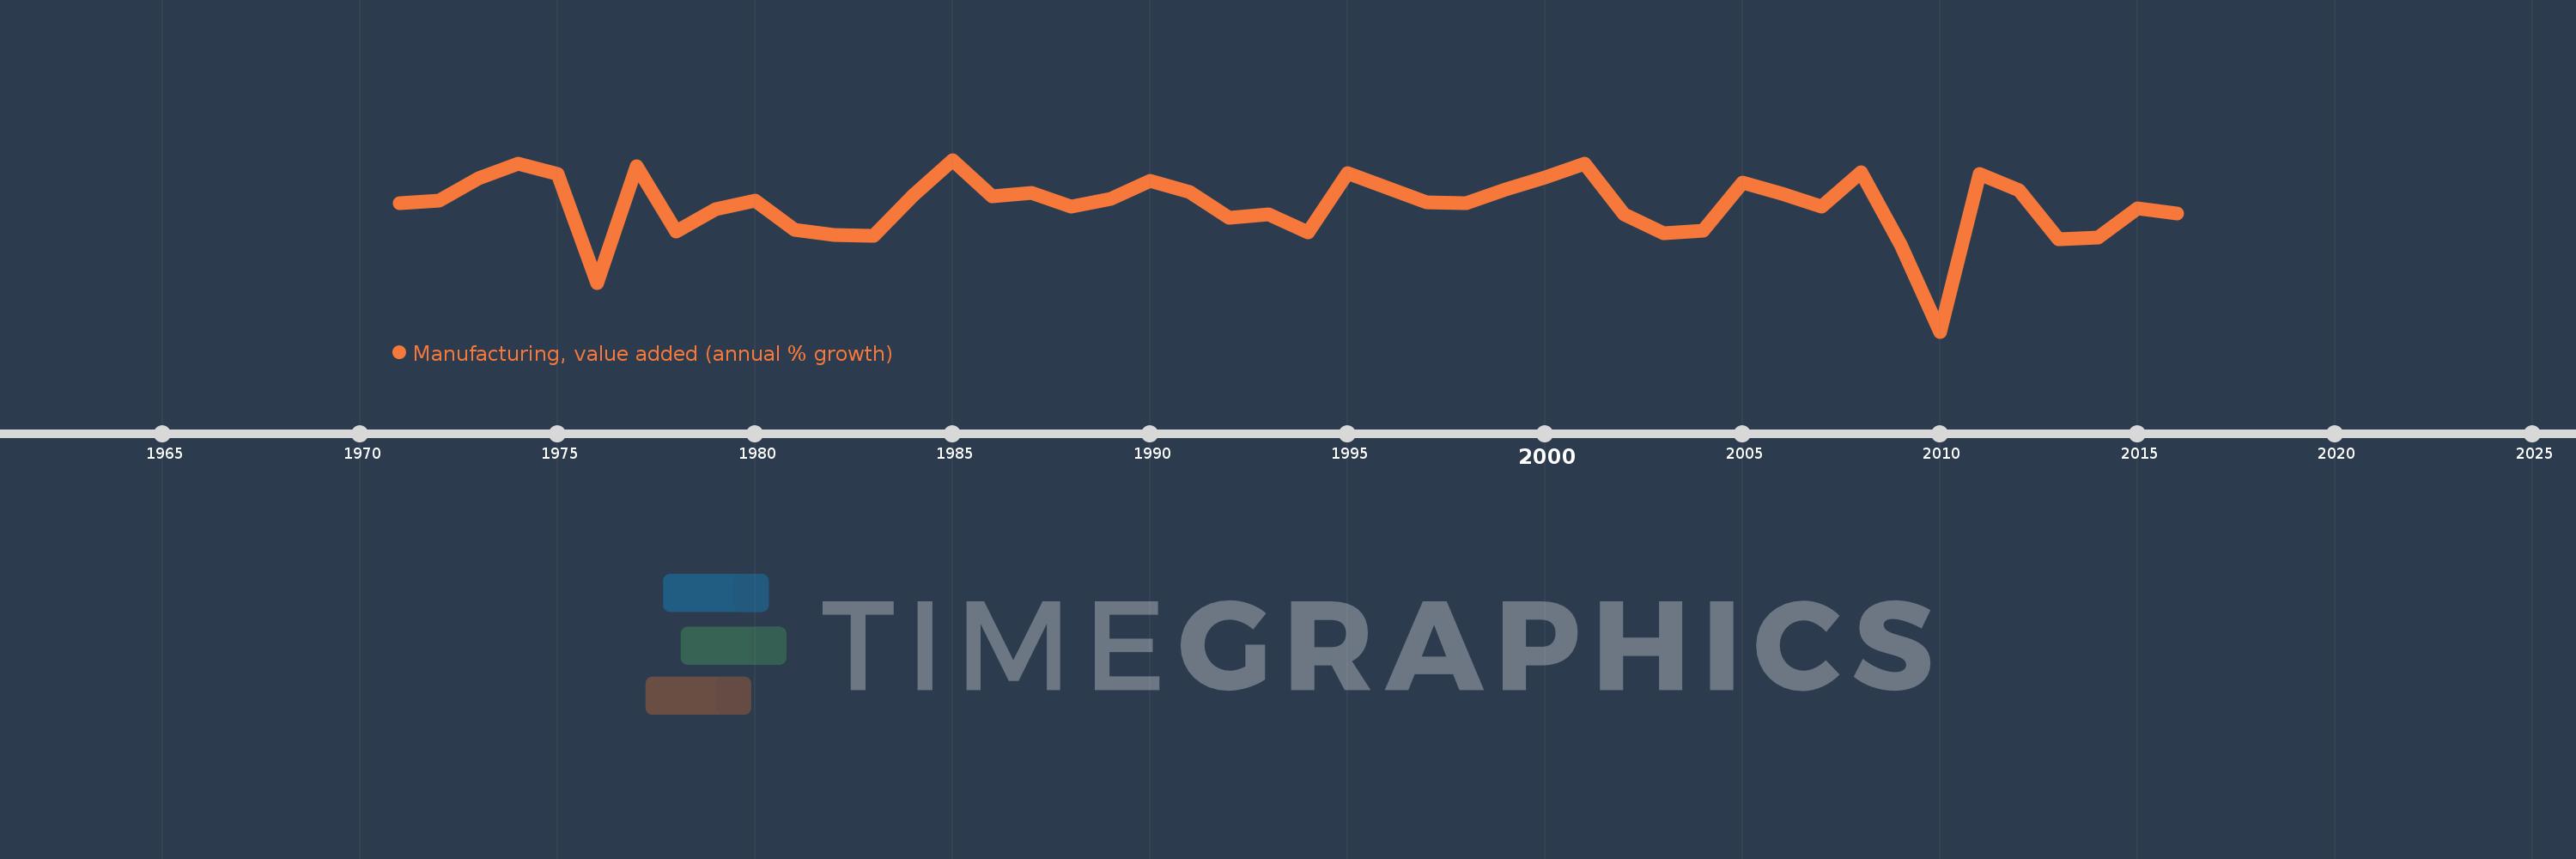
Manufacturing, value added (annual % growth)
2016,2015,2014,2013,2012,2011,2010,2009,2008,2007,2006,2005,2004,2003,2002,2001,2000,1999,1998,1997,1996,1995,1994,1993,1992,1991,1990,1989,1988,1987,1986,1985,1984,1983,1982,1981,1980,1979,1978,1977,1976,1975,1974,1973,1972,1971
Estas estatísticas em outros países:
AfghanistanAlbaniaAlgeriaAntigua and BarbudaArab WorldArgentinaArmeniaAustraliaAustriaAzerbaijanBahamas, TheBahrainBangladeshBelarusBelgiumBelizeBeninBermudaBhutanBoliviaBosnia and HerzegovinaBotswanaBrazilBrunei DarussalamBurkina FasoBurundiCabo VerdeCambodiaCameroonCanadaCaribbean small statesCayman IslandsCentral African RepublicCentral Europe and the BalticsChadChileColombiaComorosCongo, Dem. Rep.Congo, Rep.Costa RicaCote d'IvoireCroatiaCubaCyprusCzech RepublicDenmarkDjiboutiDominicaDominican RepublicEarly-demographic dividendEcuadorEgypt, Arab Rep.El SalvadorEquatorial GuineaEritreaEstoniaEthiopiaEuro areaEurope & Central AsiaEurope & Central Asia (excluding high income)Europe & Central Asia (IDA & IBRD countries)European UnionFijiFinlandFragile and conflict affected situationsFranceGabonGambia, TheGeorgiaGermanyGhanaGreeceGrenadaGuatemalaGuineaGuyanaHaitiHeavily indebted poor countries (HIPC)High incomeHondurasHong Kong SAR, ChinaHungaryIcelandIDA blendIDA onlyIDA totalIndiaIndonesiaIran, Islamic Rep.IraqIrelandItalyJamaicaJapanJordanKazakhstanKenyaKiribatiKorea, Rep.KosovoKuwaitKyrgyz RepublicLao PDRLatin America & Caribbean Latin America & Caribbean (excluding high income)Latin America & the Caribbean (IDA & IBRD countries)LatviaLeast developed countries: UN classificationLebanonLesothoLiberiaLithuaniaLow incomeLower middle incomeLuxembourgMacedonia, FYRMadagascarMalawiMalaysiaMaldivesMarshall IslandsMauritaniaMauritiusMexicoMicronesia, Fed. Sts.Middle East & North AfricaMiddle East & North Africa (excluding high income)Middle East & North Africa (IDA & IBRD countries)MoldovaMongoliaMontenegroMoroccoMozambiqueMyanmarNamibiaNepalNetherlandsNew ZealandNicaraguaNigerNigeriaNorth AmericaNorwayOECD membersOmanOther small statesPacific island small statesPakistanPalauPanamaPapua New GuineaParaguayPeruPhilippinesPolandPortugalPost-demographic dividendPre-demographic dividendPuerto RicoQatarRomaniaRussian FederationRwandaSamoaSao Tome and PrincipeSaudi ArabiaSenegalSerbiaSeychellesSierra LeoneSingaporeSlovak RepublicSloveniaSmall statesSolomon IslandsSomaliaSouth AfricaSouth AsiaSouth Asia (IDA & IBRD)SpainSri LankaSt. Kitts and NevisSt. LuciaSt. Vincent and the GrenadinesSub-Saharan Africa Sub-Saharan Africa (excluding high income)Sub-Saharan Africa (IDA & IBRD countries)SudanSurinameSwazilandSwedenSwitzerlandSyrian Arab RepublicTajikistanTanzaniaThailandTimor-LesteTogoTongaTrinidad and TobagoTunisiaTurkeyTuvaluUgandaUkraineUnited Arab EmiratesUnited KingdomUnited StatesUruguayUzbekistanVanuatuVenezuela, RBVietnamWest Bank and GazaWorldZambiaZimbabwe Linha do tempo:
Nesta escala de tempo está apresentado um gráfico de 1971 ano até 2016 ano Netherlands. Dados de 1970 ano ausente. O número de observações reais por data: 46.
Fonte (nome):
Indicadores de desenvolvimento mundial
Fonte (organização):
World Bank national accounts data, and OECD National Accounts data files.
Categorias:
Economy & Growth
Foi atualizado:
23 abr 2017 ano
Indicadores de alterações dos valores ao longo dos anos
Mínimo:
-10.83
1 jan 2010 ano
Máximo:
6.71
1 jan 1985 ano
Na data de observação
Valor
Mudança absoluta
A alteração em relação ao valor anterior
1 jan 1971 ano
2.266
+2.266
0.0%
1 jan 1972 ano
2.511
+0.245
10.81%
1 jan 1973 ano
4.83
+2.319
92.34%
1 jan 1974 ano
6.283
+1.453
30.08%
1 jan 1975 ano
5.263
-1.02
-16.24%
1 jan 1976 ano
-5.851
-11.114
-211.19%
1 jan 1977 ano
6.053
+11.904
-203.45%
1 jan 1978 ano
-0.578
-6.631
-109.56%
1 jan 1979 ano
1.679
+2.257
-390.24%
1 jan 1980 ano
2.578
+0.899
53.54%
1 jan 1981 ano
-0.452
-3.029
-117.53%
1 jan 1982 ano
-0.939
-0.487
107.83%
1 jan 1983 ano
-1.011
-0.072
7.63%
1 jan 1984 ano
3.111
+4.122
-407.85%
1 jan 1985 ano
6.71
+3.599
115.67%
1 jan 1986 ano
3.007
-3.703
-55.19%
1 jan 1987 ano
3.376
+0.37
12.29%
1 jan 1988 ano
1.931
-1.446
-42.81%
1 jan 1989 ano
2.736
+0.805
41.7%
1 jan 1990 ano
4.584
+1.848
67.53%
1 jan 1991 ano
3.461
-1.123
-24.49%
1 jan 1992 ano
0.768
-2.693
-77.81%
1 jan 1993 ano
1.107
+0.339
44.13%
1 jan 1994 ano
-0.712
-1.82
-164.35%
1 jan 1995 ano
5.321
+6.033
-846.88%
1 jan 1996 ano
3.856
-1.465
-27.53%
1 jan 1997 ano
2.334
-1.522
-39.47%
1 jan 1998 ano
2.323
-0.011
-0.48%
1 jan 1999 ano
3.681
+1.358
58.47%
1 jan 2000 ano
4.906
+1.224
33.26%
1 jan 2001 ano
6.272
+1.367
27.86%
1 jan 2002 ano
1.147
-5.126
-81.72%
1 jan 2003 ano
-0.819
-1.966
-171.45%
1 jan 2004 ano
-0.482
+0.338
-41.23%
1 jan 2005 ano
4.364
+4.845
-1.01 mil%
1 jan 2006 ano
3.271
-1.093
-25.05%
1 jan 2007 ano
1.964
-1.306
-39.95%
1 jan 2008 ano
5.481
+3.517
179.07%
1 jan 2009 ano
-1.91
-7.391
-134.85%
1 jan 2010 ano
-10.83
-8.92
466.97%
1 jan 2011 ano
5.275
+16.105
-148.71%
1 jan 2012 ano
3.609
-1.666
-31.58%
1 jan 2013 ano
-1.44
-5.05
-139.91%
1 jan 2014 ano
-1.223
+0.217
-15.07%
1 jan 2015 ano
1.77
+2.993
-244.67%
1 jan 2016 ano
1.213
-0.557
-31.45%
Classificação de países por estatísticas atuais por anos


Comentários: