30
/pt/
AIzaSyAYiBZKx7MnpbEhh9jyipgxe19OcubqV5w
April 1, 2024
202643
Mozambique
MOZ
true
2
1
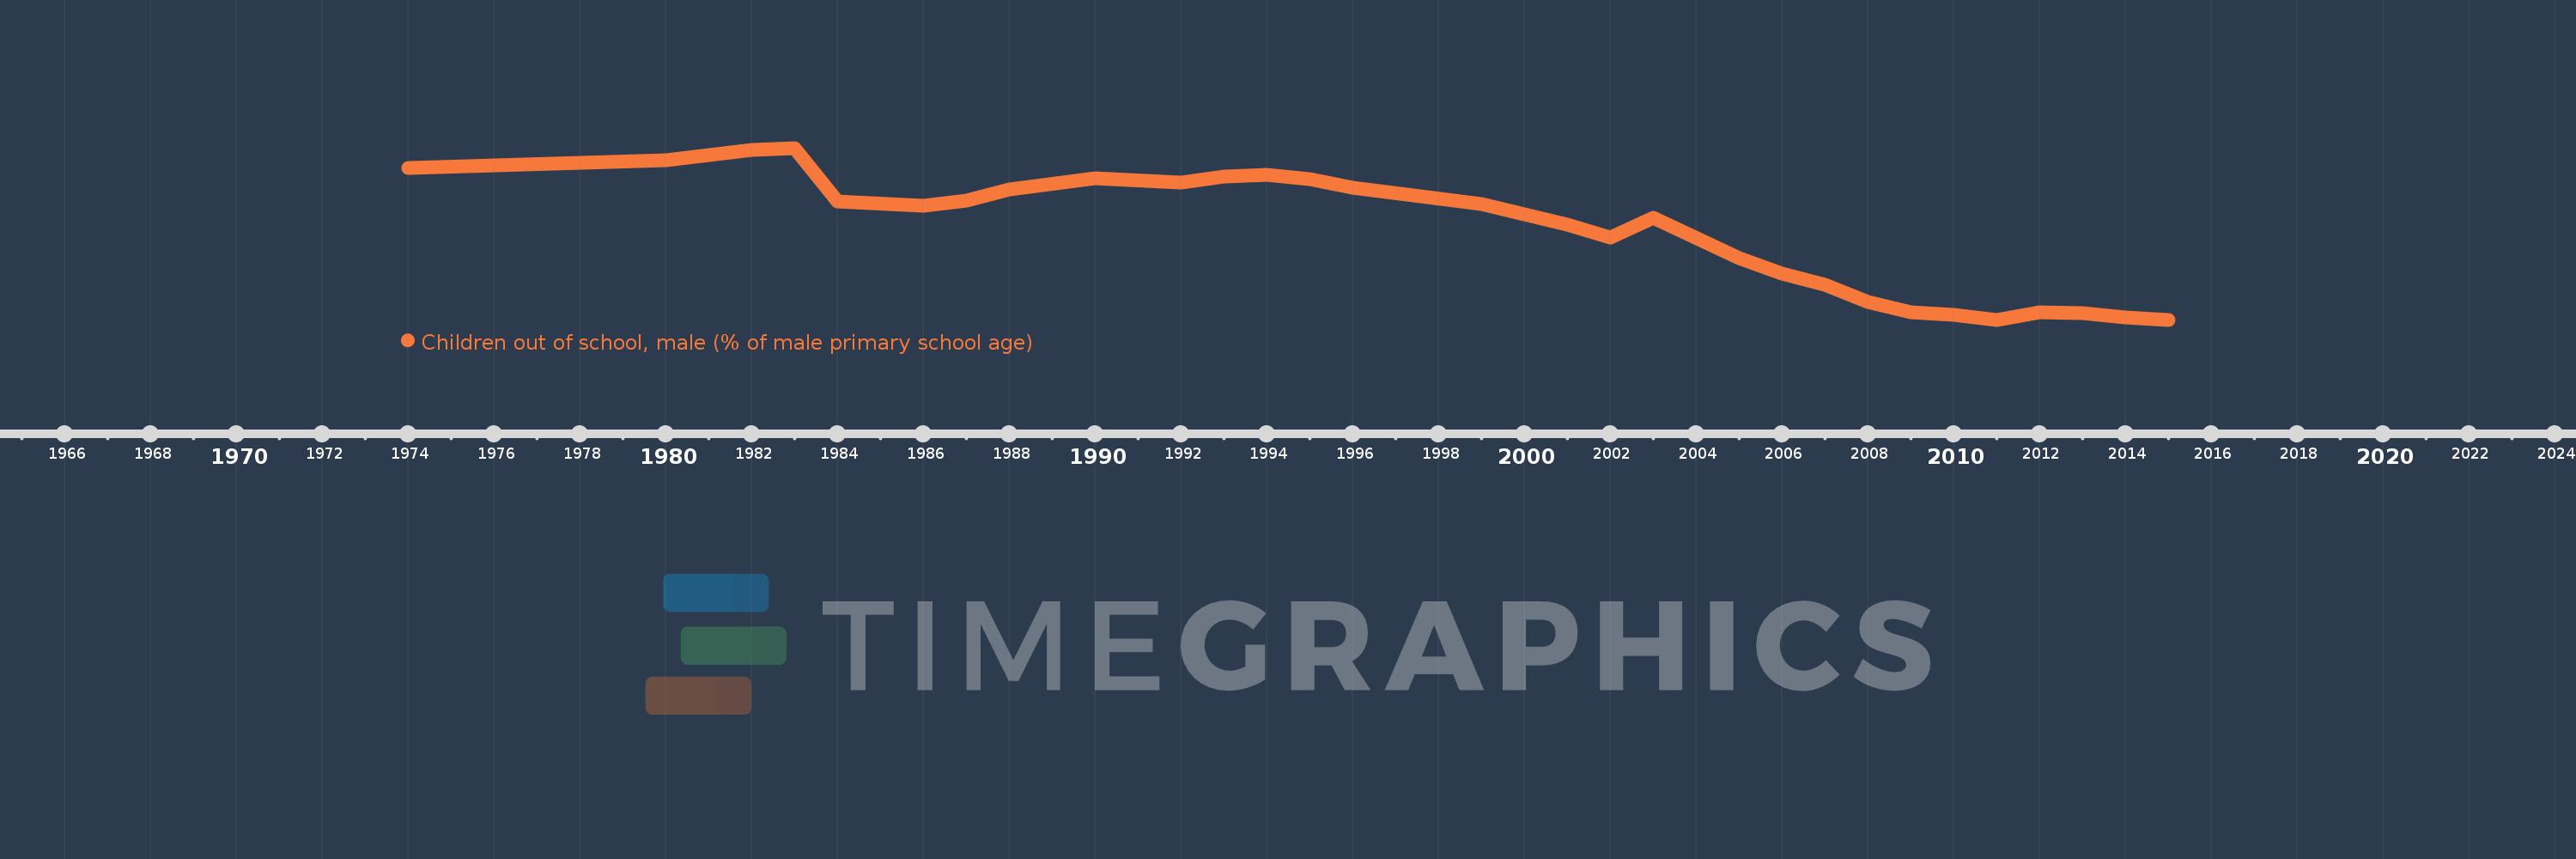
Children out of school, male (% of male primary school age)
2015,2014,2013,2012,2011,2010,2009,2008,2007,2006,2005,2003,2002,2001,2000,1999,1996,1995,1994,1993,1992,1990,1988,1987,1986,1984,1983,1982,1980,1974
