29
/pt/
pt
AIzaSyAYiBZKx7MnpbEhh9jyipgxe19OcubqV5w
April 1, 2024
182678
Luxembourg
LUX
true
2
1
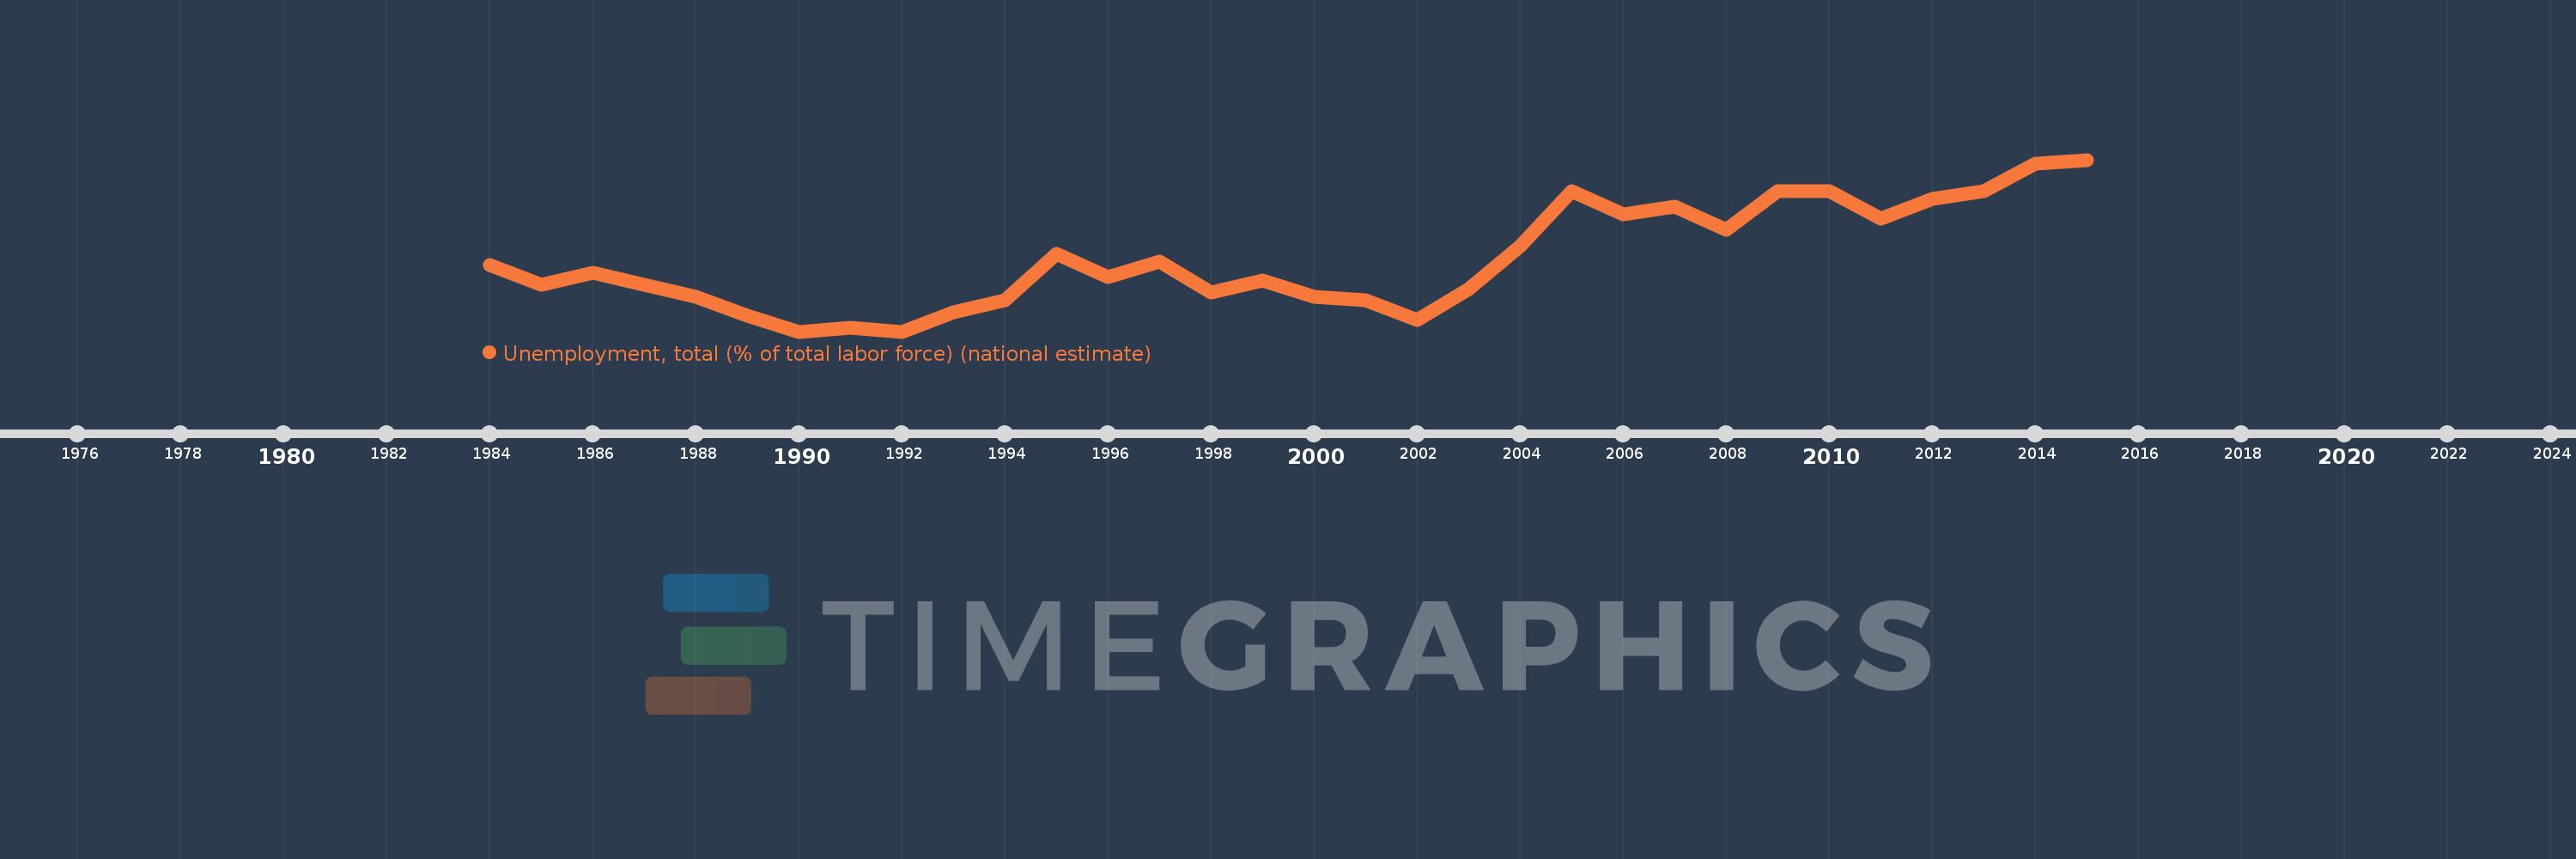
Unemployment, total (% of total labor force) (national estimate)
2015,2014,2013,2012,2011,2010,2009,2008,2007,2006,2005,2004,2003,2002,2001,2000,1999,1998,1997,1996,1995,1994,1993,1992,1991,1990,1989,1988,1987,1986,1985,1984
Estas estatísticas em outros países:
AfghanistanAlbaniaAlgeriaAmerican SamoaAntigua and BarbudaArab WorldArgentinaArmeniaArubaAustraliaAustriaAzerbaijanBahamas, TheBahrainBangladeshBarbadosBelarusBelgiumBelizeBeninBermudaBhutanBoliviaBosnia and HerzegovinaBotswanaBrazilBritish Virgin IslandsBrunei DarussalamBulgariaBurkina FasoBurundiCabo VerdeCambodiaCameroonCanadaCaribbean small statesCayman IslandsCentral Europe and the BalticsChadChileChinaColombiaComorosCongo, Dem. Rep.Costa RicaCote d'IvoireCroatiaCubaCyprusCzech RepublicDenmarkDjiboutiDominicaDominican RepublicEarly-demographic dividendEast Asia & PacificEast Asia & Pacific (excluding high income)East Asia & Pacific (IDA & IBRD countries)EcuadorEgypt, Arab Rep.El SalvadorEquatorial GuineaEstoniaEthiopiaEuro areaEurope & Central AsiaEurope & Central Asia (excluding high income)Europe & Central Asia (IDA & IBRD countries)European UnionFaroe IslandsFijiFinlandFranceFrench PolynesiaGabonGambia, TheGeorgiaGermanyGhanaGibraltarGreeceGreenlandGrenadaGuamGuatemalaGuineaGuyanaHaitiHigh incomeHondurasHong Kong SAR, ChinaHungaryIBRD onlyIcelandIDA & IBRD totalIDA blendIndiaIndonesiaIran, Islamic Rep.IraqIrelandIsle of ManIsraelItalyJamaicaJapanJordanKazakhstanKenyaKiribatiKorea, Rep.KosovoKuwaitKyrgyz RepublicLao PDRLate-demographic dividendLatin America & Caribbean Latin America & Caribbean (excluding high income)Latin America & the Caribbean (IDA & IBRD countries)LatviaLebanonLesothoLiberiaLibyaLiechtensteinLithuaniaLow & middle incomeLower middle incomeLuxembourgMacao SAR, ChinaMacedonia, FYRMadagascarMalawiMalaysiaMaldivesMaliMaltaMarshall IslandsMauritaniaMauritiusMexicoMiddle East & North AfricaMiddle East & North Africa (excluding high income)Middle East & North Africa (IDA & IBRD countries)Middle incomeMoldovaMonacoMongoliaMontenegroMoroccoMozambiqueMyanmarNamibiaNauruNepalNetherlandsNew CaledoniaNew ZealandNicaraguaNigerNigeriaNorth AmericaNorthern Mariana IslandsNorwayOECD membersPakistanPalauPanamaPapua New GuineaParaguayPeruPhilippinesPolandPortugalPost-demographic dividendPuerto RicoQatarRomaniaRussian FederationRwandaSamoaSan MarinoSao Tome and PrincipeSaudi ArabiaSenegalSerbiaSeychellesSierra LeoneSingaporeSlovak RepublicSloveniaSolomon IslandsSouth AfricaSouth AsiaSouth Asia (IDA & IBRD)South SudanSpainSri LankaSt. Kitts and NevisSt. LuciaSt. Vincent and the GrenadinesSudanSurinameSwazilandSwedenSwitzerlandSyrian Arab RepublicTajikistanTanzaniaThailandTimor-LesteTongaTrinidad and TobagoTunisiaTurkeyTurks and Caicos IslandsTuvaluUgandaUkraineUnited Arab EmiratesUnited KingdomUnited StatesUpper middle incomeUruguayVanuatuVenezuela, RBVietnamWest Bank and GazaWorldYemen, Rep.ZambiaZimbabwe Linha do tempo:
Nesta escala de tempo está apresentado um gráfico de 1984 ano até 2015 ano Luxembourg. Dados de 1983 ano ausente. O número de observações reais por data: 32.
Fonte (nome):
Indicadores de desenvolvimento mundial
Fonte (organização):
International Labour Organization, Key Indicators of the Labour Market database.
Categorias:
Social Protection & Labor
Foi atualizado:
23 abr 2017 ano
Indicadores de alterações dos valores ao longo dos anos
Na data de observação
Valor
Mudança absoluta
A alteração em relação ao valor anterior
1 jan 1984 ano
3.2
+3.2
0.0%
1 jan 1985 ano
2.7
-0.5
-15.62%
1 jan 1986 ano
3.0
+0.3
11.11%
1 jan 1987 ano
2.7
-0.3
-10.0%
1 jan 1988 ano
2.4
-0.3
-11.11%
1 jan 1989 ano
1.9
-0.5
-20.83%
1 jan 1990 ano
1.5
-0.4
-21.05%
1 jan 1991 ano
1.6
+0.1
6.67%
1 jan 1992 ano
1.5
-0.1
-6.25%
1 jan 1993 ano
2.0
+0.5
33.33%
1 jan 1994 ano
2.3
+0.3
15.0%
1 jan 1995 ano
3.5
+1.2
52.17%
1 jan 1996 ano
2.9
-0.6
-17.14%
1 jan 1997 ano
3.3
+0.4
13.79%
1 jan 1998 ano
2.5
-0.8
-24.24%
1 jan 1999 ano
2.8
+0.3
12.0%
1 jan 2000 ano
2.4
-0.4
-14.29%
1 jan 2001 ano
2.3
-0.1
-4.17%
1 jan 2002 ano
1.8
-0.5
-21.74%
1 jan 2003 ano
2.6
+0.8
44.44%
1 jan 2004 ano
3.7
+1.1
42.31%
1 jan 2005 ano
5.1
+1.4
37.84%
1 jan 2006 ano
4.5
-0.6
-11.76%
1 jan 2007 ano
4.7
+0.2
4.44%
1 jan 2008 ano
4.1
-0.6
-12.77%
1 jan 2009 ano
5.1
+1.0
24.39%
1 jan 2010 ano
5.1
0.0
0.0%
1 jan 2011 ano
4.4
-0.7
-13.73%
1 jan 2012 ano
4.9
+0.5
11.36%
1 jan 2013 ano
5.1
+0.2
4.08%
1 jan 2014 ano
5.8
+0.7
13.73%
1 jan 2015 ano
5.9
+0.1
1.72%
Classificação de países por estatísticas atuais por anos


Comentários: