30
/pt/
AIzaSyAYiBZKx7MnpbEhh9jyipgxe19OcubqV5w
April 1, 2024
180383
Libya
LBY
true
2
1
School enrollment, secondary (gross), gender parity index (GPI)
2007,2006,2004,2003,1987,1984,1982,1981,1980,1979,1978,1977,1976,1975,1974,1973,1972
Download
Biblioteca de estatísticas globais →Libya →

School enrollment, secondary (gross), gender parity index (GPI)

Estas estatísticas em outros países:

AfghanistanAlbaniaAlgeriaAndorraAngolaAntigua and BarbudaArab WorldArgentinaArmeniaArubaAustraliaAustriaAzerbaijanBahamas, TheBahrainBangladeshBarbadosBelarusBelgiumBelizeBeninBermudaBhutanBoliviaBosnia and HerzegovinaBotswanaBrazilBrunei DarussalamBulgariaBurkina FasoBurundiCabo VerdeCambodiaCameroonCanadaCaribbean small statesCentral African RepublicCentral Europe and the BalticsChadChileChinaColombiaComorosCongo, Dem. Rep.Congo, Rep.Costa RicaCote d'IvoireCroatiaCubaCuracaoCyprusCzech RepublicDenmarkDjiboutiDominicaDominican RepublicEarly-demographic dividendEast Asia & PacificEast Asia & Pacific (excluding high income)East Asia & Pacific (IDA & IBRD countries)EcuadorEgypt, Arab Rep.El SalvadorEquatorial GuineaEritreaEstoniaEthiopiaEuro areaEurope & Central AsiaEurope & Central Asia (excluding high income)Europe & Central Asia (IDA & IBRD countries)European UnionFijiFinlandFragile and conflict affected situationsFranceGabonGambia, TheGeorgiaGermanyGhanaGreeceGrenadaGuatemalaGuineaGuinea-BissauGuyanaHeavily indebted poor countries (HIPC)High incomeHondurasHong Kong SAR, ChinaHungaryIBRD onlyIcelandIDA & IBRD totalIDA blendIDA onlyIDA totalIndiaIndonesiaIran, Islamic Rep.IraqIrelandIsraelItalyJamaicaJapanJordanKazakhstanKenyaKiribatiKorea, Dem. People’s Rep.Korea, Rep.KuwaitKyrgyz RepublicLao PDRLate-demographic dividendLatin America & Caribbean Latin America & Caribbean (excluding high income)Latin America & the Caribbean (IDA & IBRD countries)LatviaLeast developed countries: UN classificationLebanonLesothoLiberiaLibyaLiechtensteinLithuaniaLow & middle incomeLow incomeLower middle incomeLuxembourgMacao SAR, ChinaMacedonia, FYRMadagascarMalawiMaldivesMaliMaltaMarshall IslandsMauritaniaMauritiusMexicoMicronesia, Fed. Sts.Middle East & North AfricaMiddle East & North Africa (excluding high income)Middle East & North Africa (IDA & IBRD countries)Middle incomeMoldovaMongoliaMontenegroMoroccoMozambiqueMyanmarNamibiaNauruNepalNetherlandsNew ZealandNicaraguaNigerNigeriaNorth AmericaNorwayOECD membersOmanOther small statesPacific island small statesPakistanPalauPanamaPapua New GuineaParaguayPeruPhilippinesPolandPortugalPost-demographic dividendPre-demographic dividendPuerto RicoQatarRomaniaRussian FederationRwandaSamoaSan MarinoSao Tome and PrincipeSaudi ArabiaSenegalSerbiaSeychellesSierra LeoneSlovak RepublicSloveniaSmall statesSolomon IslandsSomaliaSouth AfricaSouth AsiaSouth Asia (IDA & IBRD)SpainSri LankaSt. Kitts and NevisSt. LuciaSt. Vincent and the GrenadinesSub-Saharan Africa Sub-Saharan Africa (excluding high income)Sub-Saharan Africa (IDA & IBRD countries)SudanSurinameSwazilandSwedenSwitzerlandSyrian Arab RepublicTajikistanTanzaniaThailandTimor-LesteTogoTongaTrinidad and TobagoTunisiaTurkeyTurkmenistanTuvaluUgandaUkraineUnited Arab EmiratesUnited KingdomUnited StatesUpper middle incomeUruguayUzbekistanVanuatuVenezuela, RBVietnamWest Bank and GazaWorldYemen, Rep.ZambiaZimbabwe

Linha do tempo:

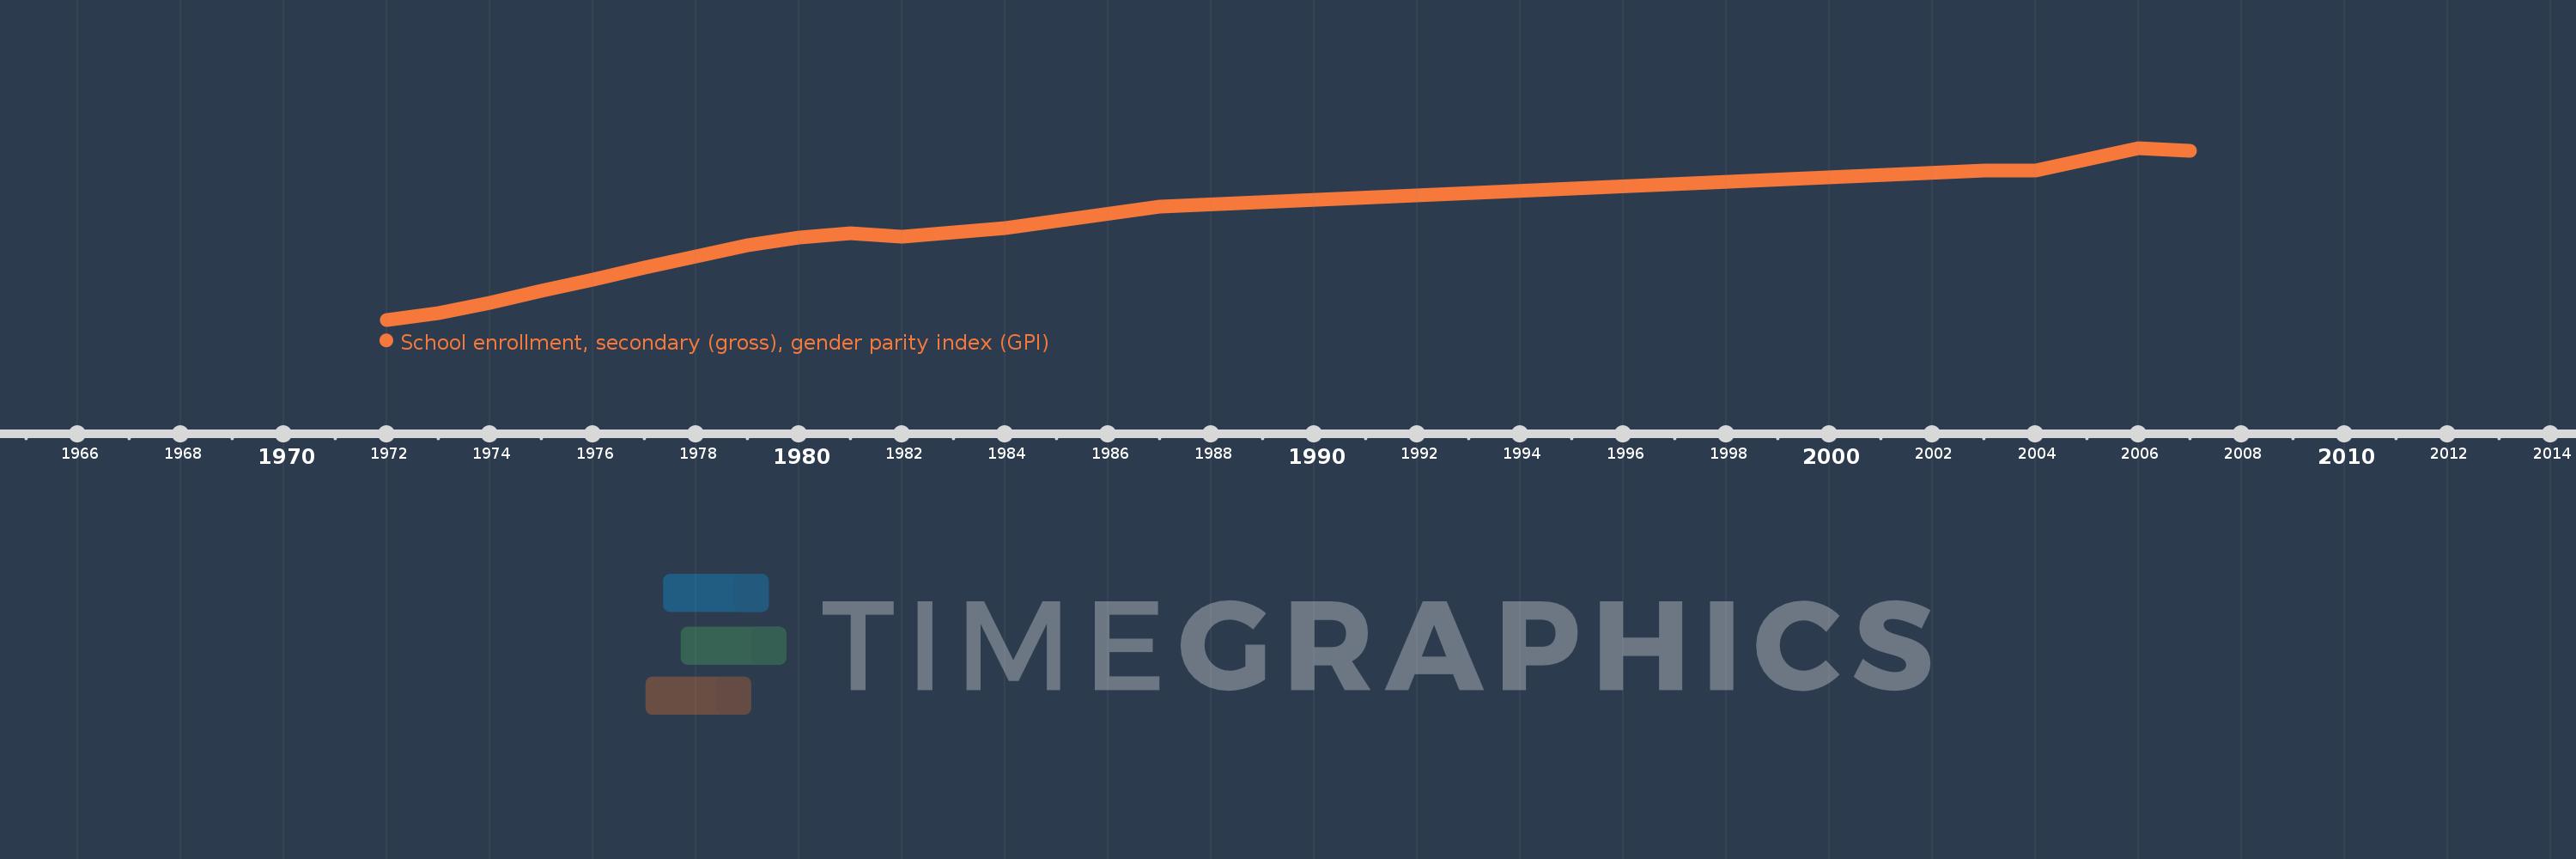
Nesta escala de tempo está apresentado um gráfico de 1972 ano até 2007 ano Libya. Dados de 1971 ano ausente. O número de observações reais por data: 17.

Fonte (nome):

Indicadores de desenvolvimento mundial

Fonte (organização):

United Nations Educational, Scientific, and Cultural Organization (UNESCO) Institute for Statistics.

Categorias:

Education, Gender, Social Development

Foi atualizado:

23 abr 2017 ano

Indicadores de alterações dos valores ao longo dos anos

Em média:
0.681
Mínimo:
0.224
1 jan 1972 ano
Máximo:
1.192
1 jan 2006 ano
Na data de observação
Valor
Mudança absoluta
A alteração em relação ao valor anterior
1 jan 1972 ano
0.224
+0.224
0.0%
1 jan 1973 ano
0.26
+0.036
16.0%
1 jan 1974 ano
0.317
+0.057
22.0%
1 jan 1975 ano
0.389
+0.072
22.66%
1 jan 1976 ano
0.451
+0.062
15.91%
1 jan 1977 ano
0.518
+0.067
14.92%
1 jan 1978 ano
0.58
+0.062
12.05%
1 jan 1979 ano
0.644
+0.064
11.04%
1 jan 1980 ano
0.686
+0.041
6.39%
1 jan 1981 ano
0.709
+0.023
3.37%
1 jan 1982 ano
0.694
-0.014
-2.03%
1 jan 1984 ano
0.739
+0.045
6.49%
1 jan 1987 ano
0.863
+0.124
16.76%
1 jan 2003 ano
1.066
+0.203
23.48%
1 jan 2004 ano
1.066
+0.0
0.01%
1 jan 2006 ano
1.192
+0.125
11.77%
1 jan 2007 ano
1.175
-0.016
-1.37%

Classificação de países por estatísticas atuais por anos